Updated on 19 May 2026
The Champagne vineyard holds a unique place in the French wine-growing land market: it is the only one to durably exceed the symbolic threshold of one million euros per hectare. This distinctive feature rests on a unique economic model, regulated by the Comité interprofessionnel des vins de Champagne (CIVC), which combines a strictly delimited appellation, production quotas and the structured organisation of grower-trade relations. Here we analyse the price of wine-growing vines in Champagne over the 2020-2025 period, based on DVF (Land Value Requests) data and SAFER references. The 2024 figures are our robust reference year; the 2025 figures, now complete, validate the trends. The 2025 DVF median price remains anchored at €1,000,000/ha, extending the remarkable stability of the Champagne market. Note: the year 2020 covers only the second half, as the DVF database was activated only in mid-2020. This article is part of our observatory of vineyard prices in France.
The Champagne vineyard covers approximately 34,300 hectares classified as AOC, distributed mainly between the Marne, the Aube and the Aisne, and more marginally the Haute-Marne and the Seine-et-Marne. With 2,293 DVF transactions recorded over the H2 2020 – 2025 period, it is the second-largest French vineyard in terms of land transfers in our sample, behind Languedoc.
Over the entire period, the DVF average price of vines in Champagne stands at €1,006,232/ha and the median price at €1,000,000/ha. The near-coincidence between median and average, combined with a median fixed at exactly one million euros for several consecutive years, is a strong signal: the Champagne land market operates around a shared reference price, which establishes itself as the equilibrium transaction value. This is a major peculiarity compared with all other French vineyards, where medians and averages are formed on a much more spread-out distribution.
| Year | Volume | Average price | Median price | Avg. area (m²) |
|---|---|---|---|---|
| 2020 * | 153 | €1,097,057/ha | €1,100,000/ha | 3,205 |
| 2021 | 381 | €968,101/ha | €957,024/ha | 3,213 |
| 2022 | 461 | €1,005,850/ha | €999,495/ha | 3,413 |
| 2023 | 471 | €981,626/ha | €1,000,000/ha | 3,596 |
| 2024 | 426 | €1,018,789/ha | €1,000,000/ha | 3,473 |
| 2025 | 401 | €1,023,806/ha | €1,000,000/ha | 3,440 |
* 2020: second half only.
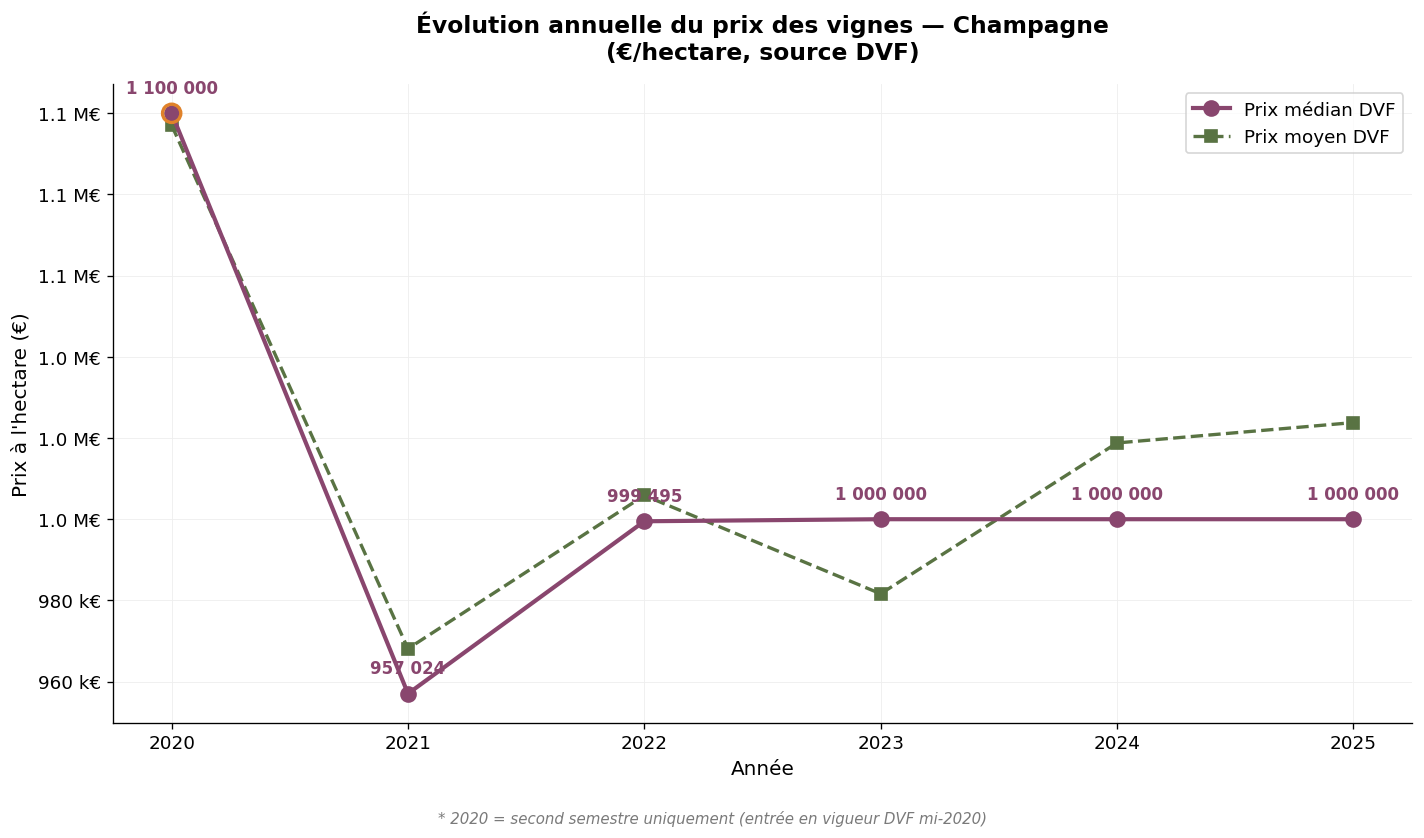
Annual evolution of vine prices in Champagne — Source: DVF, processed by ma-propriete.fr
Stability is the dominant marker of this market. In 2025, the median stands at €1,000,000/ha, identical to 2024 and 2023. Apart from a slight dip in 2021 (median at €957,024/ha), the indicator has fluctuated between €999,495 and €1,100,000/ha over the entire period. This resilience is all the more remarkable as the main French wine-growing sectors have, during the same time, experienced substantial discounts. It is explained by the indicative price mechanism for the grape cluster and by the balance of the inter-professional body: as long as the grape price remains above €6.5/kg, the land valuation remains solid. And, despite some adjustments since 2022, the grape price has broadly held up, supported by international Champagne shipments and the profitability of the trade.
The average transacted area — about 3,400 m² per transfer — is the lowest of all major French vineyards. This is a structural feature of the Champagne market: parcel fragmentation is extreme, the operating unit typically consists of several dozen parcels scattered across multiple municipalities, and transactions take place at parcel level rather than at estate level. For a buyer, this implies an acquisition logic based on successive stages, with an overall acquisition cost modulated by the targeted number of hectares.
SAFER publishes an average price each year for the Champagne vineyard, aggregated across the entire AOC territory. Over the long term, the evolution is as follows.
| Year | Average price (€/ha) | 5-year change |
|---|---|---|
| 2000 | 416,825 | — |
| 2005 | 605,629 | + 45% |
| 2010 | 858,866 | + 42% |
| 2015 | 1,143,760 | + 33% |
| 2020 | 1,041,000 | - 9% |
| 2024 | 1,121,800 | + 8% |
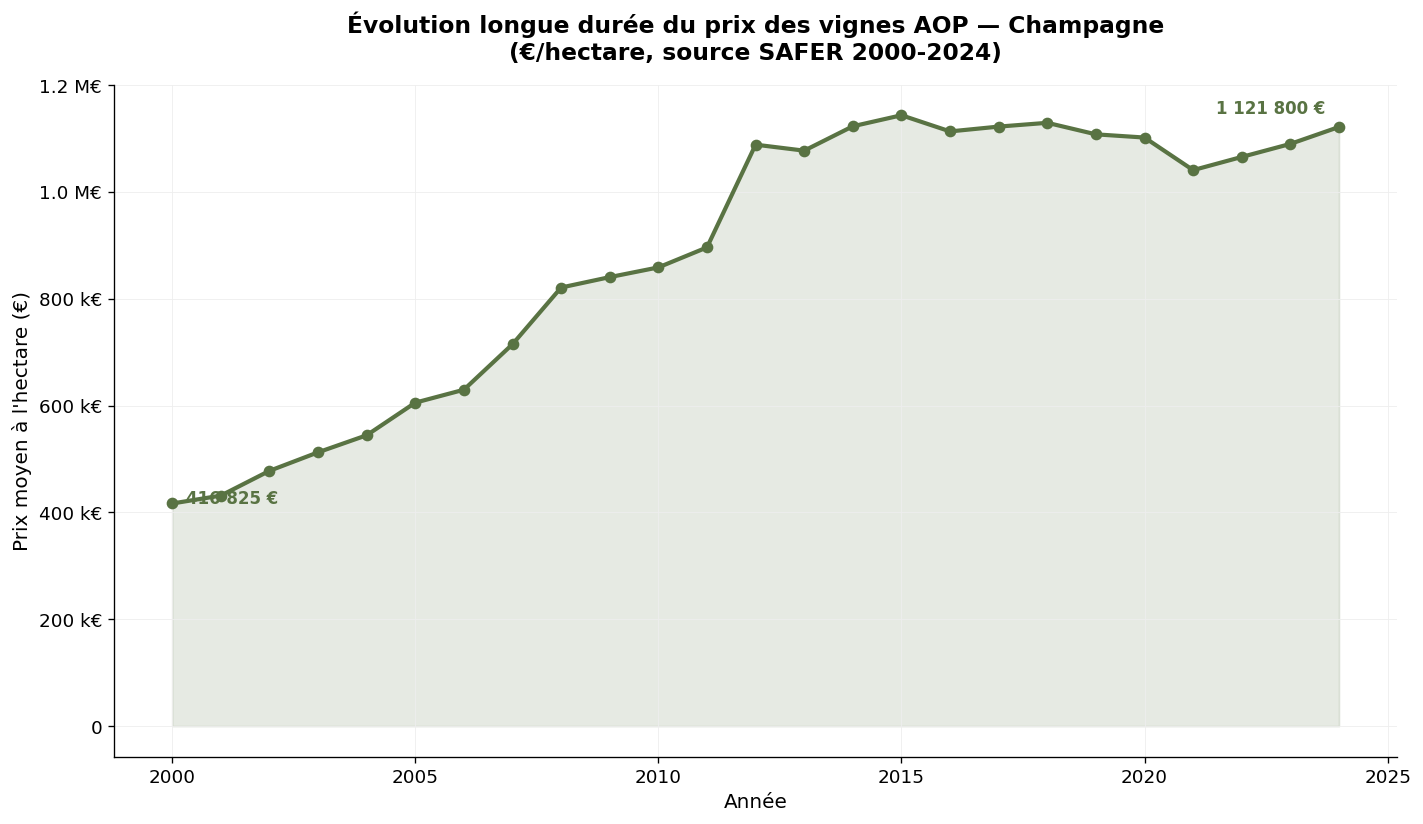
SAFER average price of AOP Champagne vines — Source: Ministry of Agriculture / SAFER
Over twenty-five years, the SAFER average price of Champagne vines has almost tripled, rising from €416,825/ha to €1,121,800/ha. Growth was particularly marked between 2000 and 2015 (+ 175%), after which the market stabilised around an equilibrium zone between €1.0 and €1.15 million per hectare. This trajectory reflects the maturity of the Champagne market: land scarcity (strictly controlled AOC extension), durable profitability upstream at the grower level and the liquidity of the AOC make it a land asset of a quality comparable to prime urban real estate.
The convergence between the SAFER average (€1,121,800/ha in 2024) and the DVF median (€1,000,000/ha) is revealing: the relatively modest gap, compared with what is observed in Bordeaux for example, confirms the homogeneity of the Champagne market. There is no land value hierarchy in Champagne comparable to that of the Bordeaux or Burgundy classified growths: the reference price applies to all segments, including grands crus, whose premium remains contained.
The distribution by department reveals the real geography of the vineyard. The Marne accounts for 71% of transactions and forms the historic heart of the AOC. The Aube, the second-largest pole in terms of volume, shows a significant discount reflecting the lesser fame of the Côte des Bar. The Aisne, the northern extension of the vineyard, occupies an intermediate position.
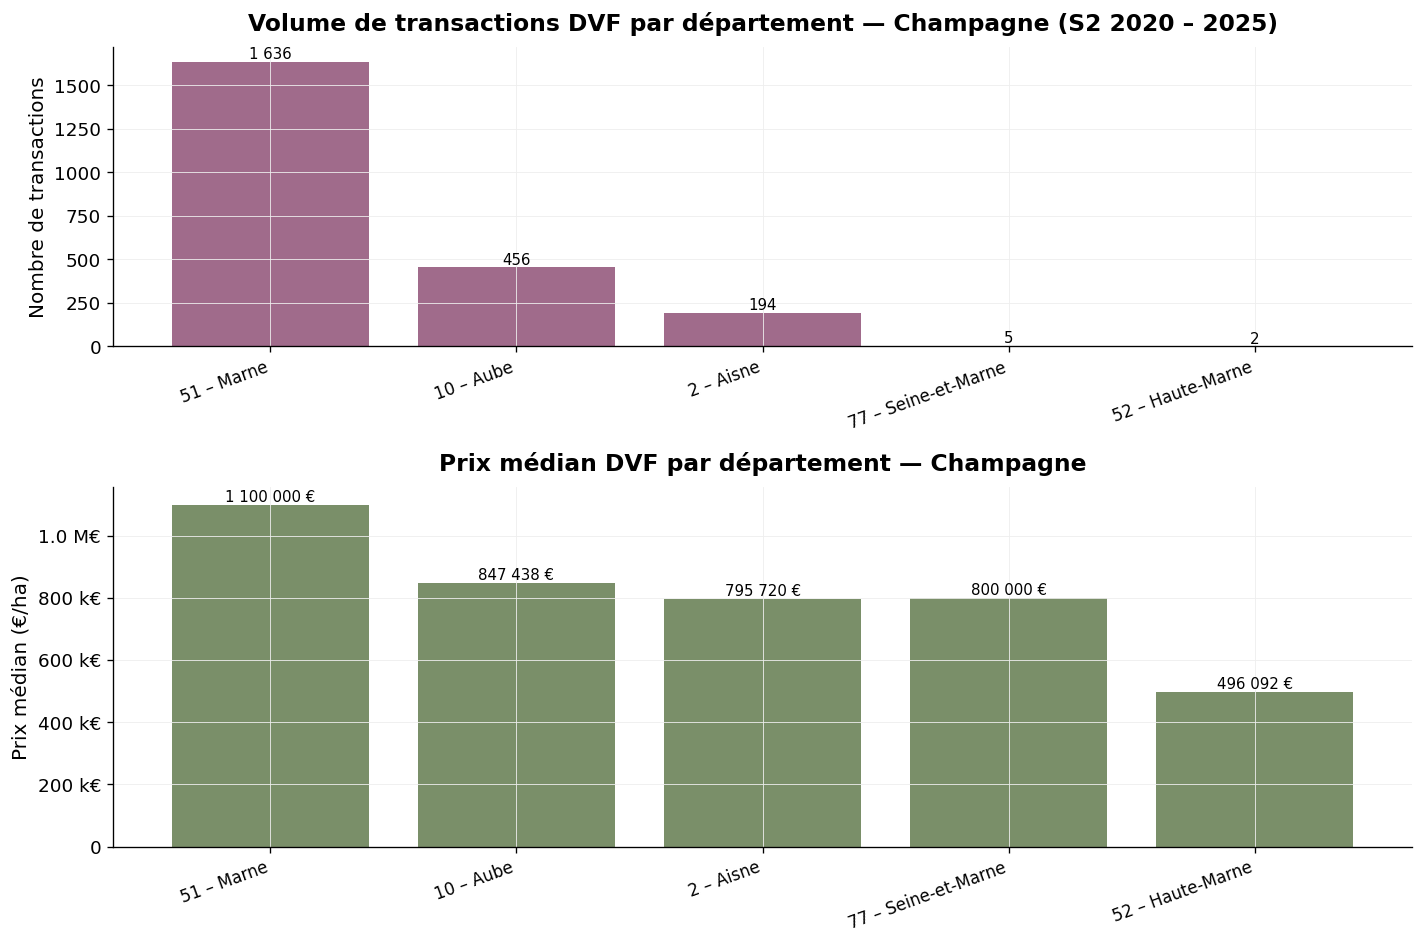
Volume and median price by department — Champagne, H2 2020 – 2025 — Source: DVF, processed by ma-propriete.fr
With 1,636 transactions over the period, the Marne represents the most active wine-growing land market in France by value. The median price stands at €1,100,000/ha (average price €1,096,429/ha), with remarkable stability from one year to the next since 2022. The department concentrates the most sought-after classification zones (Montagne de Reims, lower Marne Valley, Côte des Blancs, Épernay area) and hosts the majority of the headquarters of the great houses and cooperatives. The average transacted area — about 3,142 m² — confirms the dominant logic of parcel-by-parcel transmission.
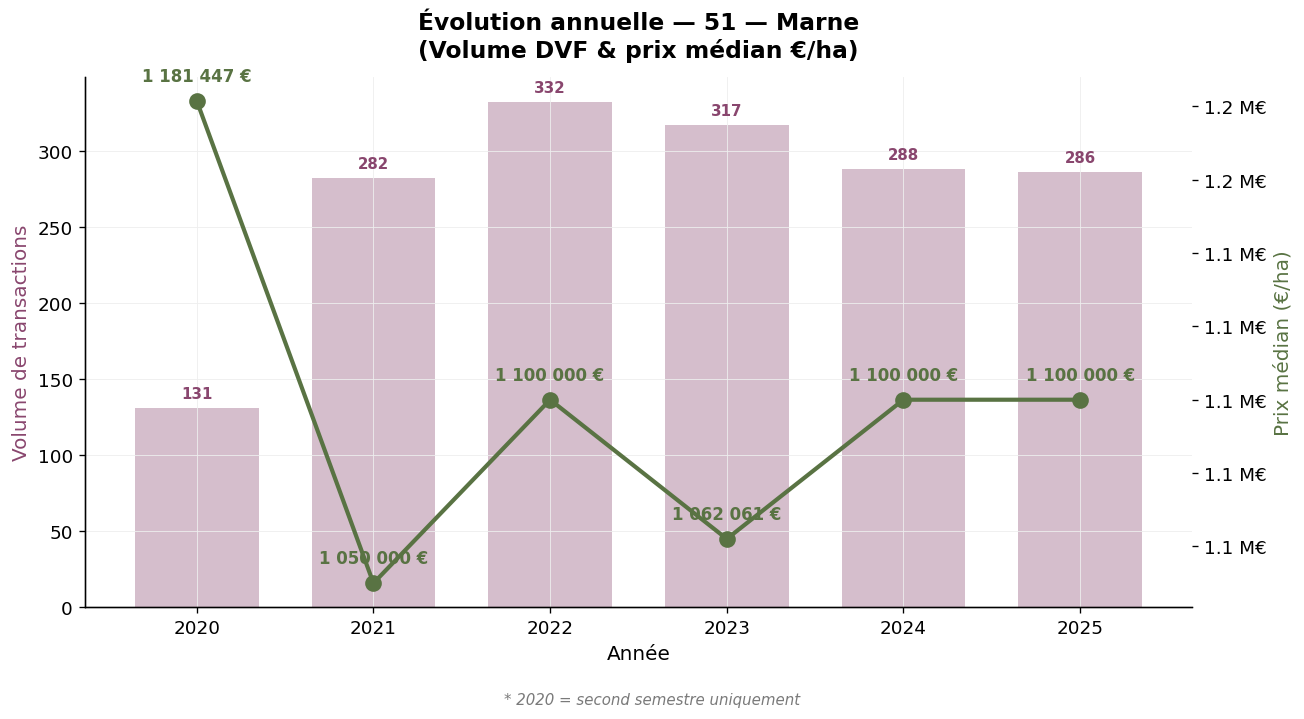
Marne (51) — Annual evolution, H2 2020 – 2025 — Source: DVF, processed by ma-propriete.fr
The second-largest department of the vineyard by volume (456 transactions), the Aube stands out with a median price significantly lower than that of the Marne: €847,438/ha over the period. This discount reflects the lesser historical fame of the Côte des Bar, further from Épernay and oriented towards distinctive pinot noir wines. The annual evolution is nonetheless solid: the median rose from €744,534/ha in 2021 to €852,122/ha in 2024, before a slight adjustment to €812,679/ha in 2025. The average area (4,362 m²) is slightly larger than in the Marne, which can facilitate the building of a coherent vineyard at a more moderate entry cost.
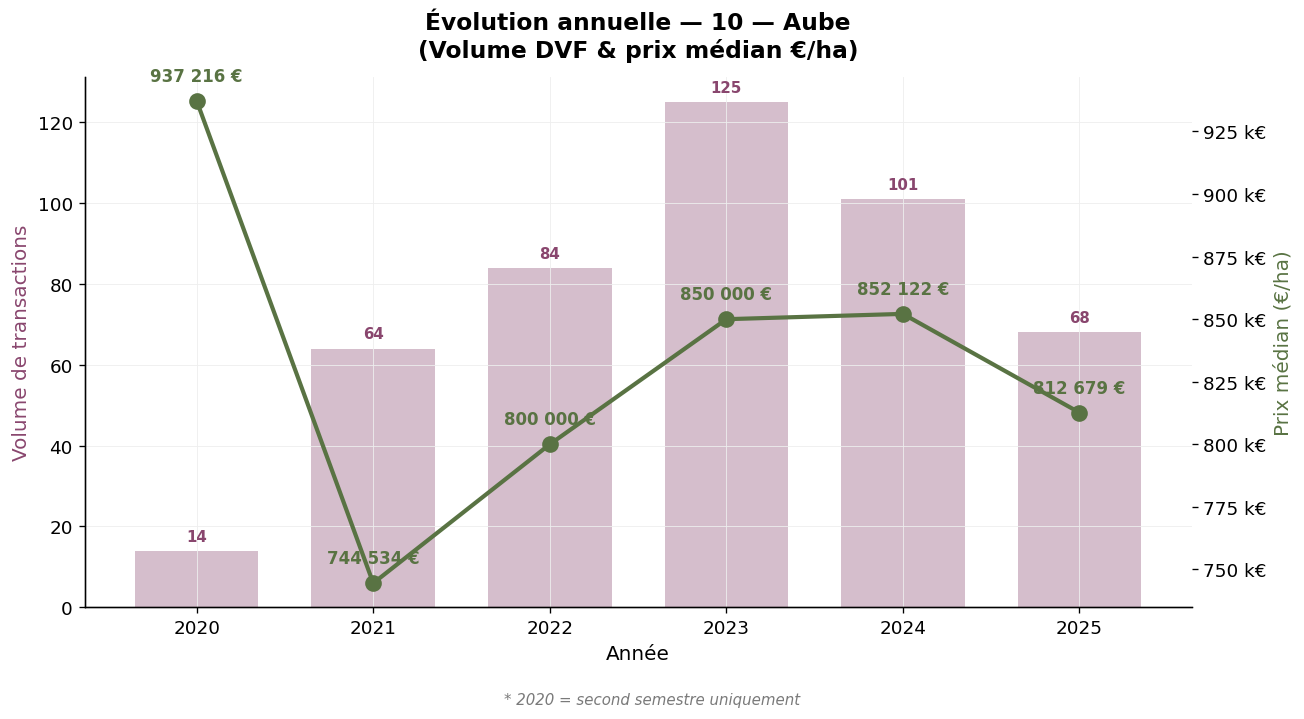
Aube (10) — Annual evolution, H2 2020 – 2025 — Source: DVF, processed by ma-propriete.fr
The Aisne represents the western extension of the vineyard, mainly along the Marne valley. With 194 transactions and a median price of €795,720/ha, the department positions itself between the Aube and the Marne. Recent momentum is strong: the median rose from €727,031/ha in 2021 to €895,313/ha in 2025, a sign of gradual catching-up with the historic core. The average transacted area (3,574 m²) is in line with Champagne practices.
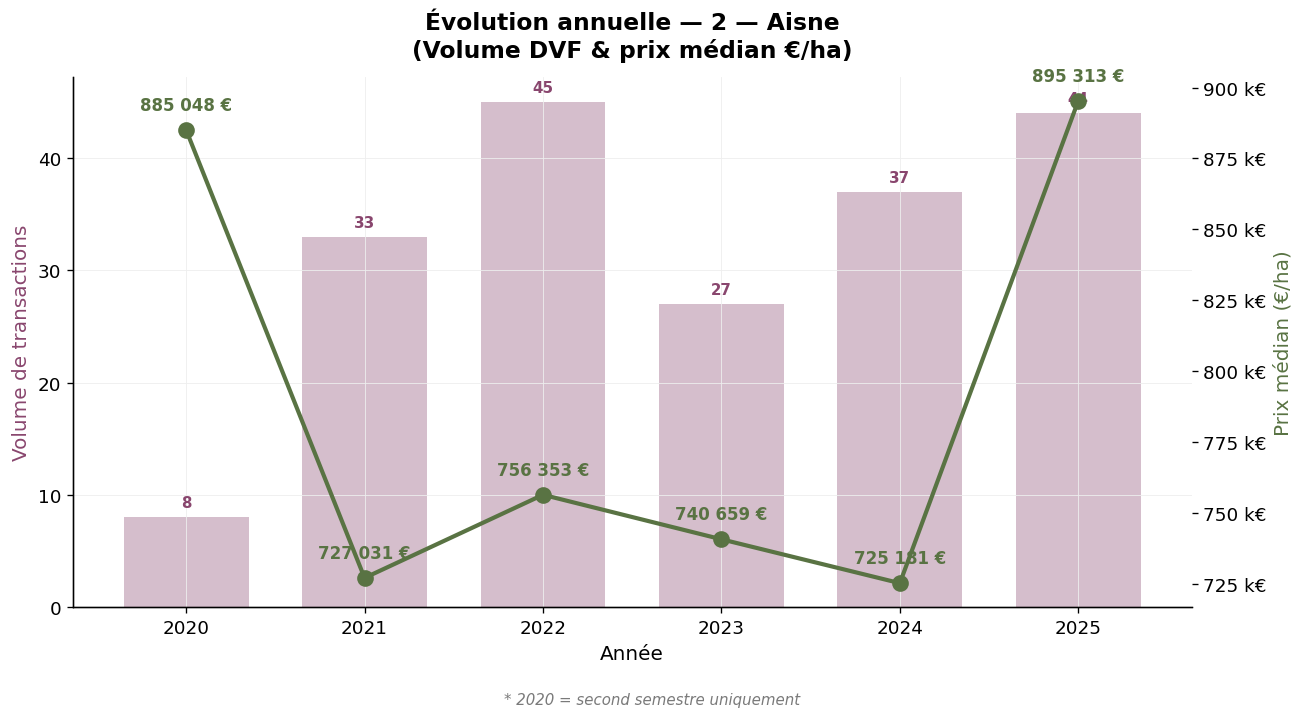
Aisne (2) — Annual evolution, H2 2020 – 2025 — Source: DVF, processed by ma-propriete.fr
These two departments represent the marginal extension of the AOC: 2 transactions in the Haute-Marne and 5 transactions in the Seine-et-Marne over the period. As the number of sales is too low to produce robust statistics, we limit ourselves to noting the consistency of the levels observed (median €800,000/ha in the Seine-et-Marne, €496,092/ha in the Haute-Marne). These figures should be interpreted with caution.
The seasonality of Champagne transactions is less marked than in other vineyards, reflecting the professional and continuous nature of the market. However, the fourth quarter concentrates 27.5% of sales, mainly linked to the accounting and tax year-end closures of sellers. The second and third quarters share around half of the activity, in a logic of more measured transactions outside the harvest and pressing period.
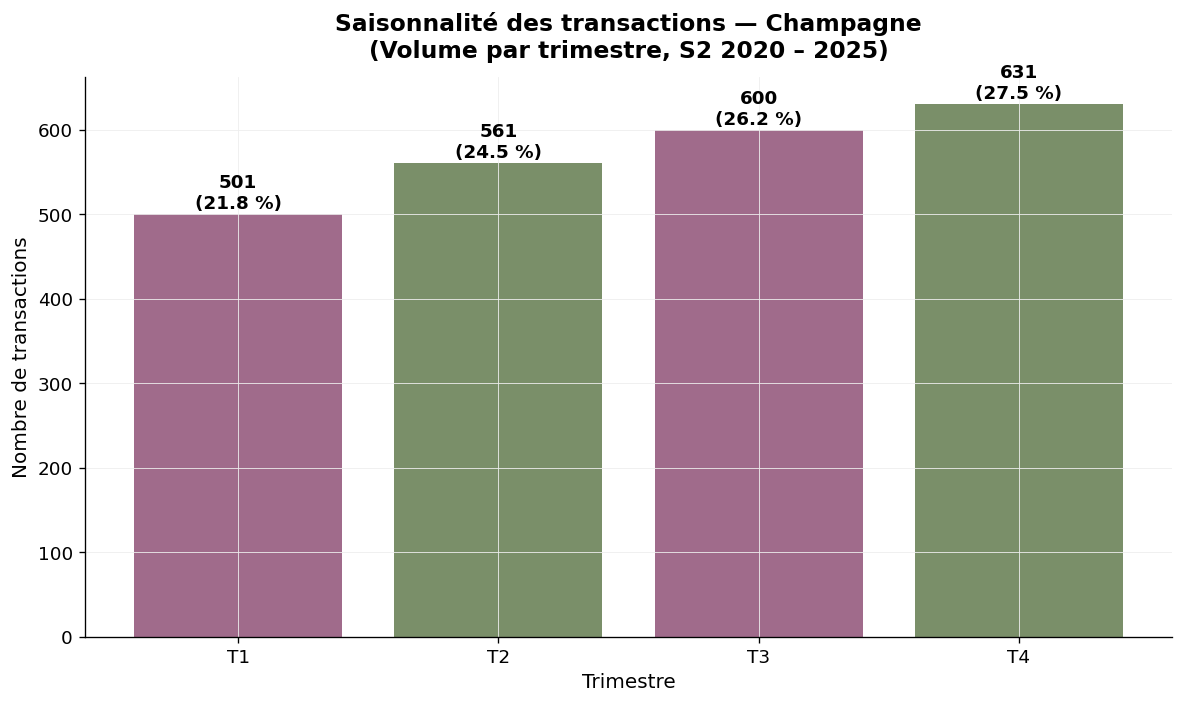
Seasonality — Champagne, volume by quarter — Source: DVF, processed by ma-propriete.fr
With a 2024 DVF median price of €1,000,000/ha, Champagne stands at more than forty times the national median (€23,337/ha in 2024) and more than five times the second-largest French vineyard by value, Burgundy. This exceptional position is explained by the combination of several factors: strictly delimited and non-extensible appellation area, production quotas ensuring stable grape prices, durable international image quality, high industrial valuation of sparkling wines and trade profitability. No other French vineyard combines all of these characteristics.
| Vineyard | 2025 median price (€/ha) | Detailed article |
|---|---|---|
| Champagne | 1,000,000 | Current article |
| Burgundy | 125,000 | Burgundy-Franche-Comté |
| Savoie | 57,216 | Savoie |
| Provence | 39,864 | Provence |
| Jura | 39,361 | Jura |
| Beaujolais | 39,312 | Beaujolais |
| Cognac | 28,636 | Cognac |
| Rhône Valley | 20,357 | Rhône Valley |
| Loire Valley | 17,000 | Loire Valley |
| Bordeaux | 15,434 | Bordeaux |
| Roussillon | 13,918 | Languedoc-Roussillon |
| Languedoc | 13,531 | Languedoc-Roussillon |
| South-West | 9,205 | South-West |
The DVF (Land Value Requests) database lists all real estate transfers for valuable consideration recorded by the DGFiP (the French tax administration). To isolate vine transactions within this database, our observatory applies several filters: selection of parcels registered with a "vines" land use, cross-referencing with the INAO directory municipality by municipality, elimination of atypical transactions (mixed properties, intra-family sales, transfers to companies at convenience prices). For each vineyard, the average price, median price, extreme values and average area are calculated. The median price, which represents the level at which half of the market is concluded, is our reference indicator; it is less sensitive to exceptional sales than the average.
Three precautions should be taken. The year 2020 covers only the second half, as the DVF database was activated only at that date. Mixed properties (parcels + cellar + operating buildings) are excluded when the value of the buildings represents a significant share; certain sales of Champagne houses with vineyards may thus be excluded. Finally, the Alsace-Moselle departments (which do not concern Champagne) are not covered by the database.
The SAFER statistics, published by the Ministry of Agriculture, are based on a survey of notaries and a filter for block transactions of more than half a hectare. They provide an annual average price with remarkable historical depth (since 1991). Our DVF approach, complementary, restores the totality of transfers and provides median, average and dispersion indicators at a finer granularity (municipality, appellation). In Champagne, the two reference frameworks converge closely, which is a strong signal of market homogeneity.
The Champagne vine market stands out for its stability, high valuation and homogeneity. The DVF median price has been anchored around one million euros per hectare since 2022, and the year 2025 confirms this equilibrium. The Marne remains the most active and most highly valued department, the Aube offers entry points at moderate cost, and the Aisne combines momentum with an intermediate level. For buyers, Champagne constitutes an exceptional land asset, the liquidity of which is high but whose access requires a significantly higher investment capacity than that needed in most other French vineyards. To go further, you can consult our wine-growing listings category, our other articles on vineyard prices or download our white paper devoted to the creation of a wine-growing estate.