Updated on May 19, 2026
The Corsican vineyard occupies a singular place in the French wine landscape. With approximately 6,000 hectares classified as AOC, it is one of the smallest in terms of surface area, but benefits from a strong identity backed by native grape varieties (niellucciu, sciaccarellu, vermentinu) and nine appellations including one regional AOC (Vin de Corse) and several communal AOCs (Patrimonio, Ajaccio, Vin de Corse Calvi, Sartène, Figari, Porto-Vecchio). We propose here an analysis of vineyard prices in Corsica over the 2020-2025 period, based on DVF data (Property Value Requests) and — above all — SAFER references, which are more representative of the island market. Please note: the DVF database contains a very limited number of vineyard transactions in Corsica, which limits the statistical scope of the analyses. This article is part of our observatory of vineyard prices in France.
The Corsican wine land market presents several characteristics that strongly distinguish it from continental wine regions. The small size of the vineyard (approximately 6,000 hectares compared to 30,000 to 100,000 for the major continental vineyards) mechanically limits the volume of transactions. The weight of multi-use land is also very significant: many plots registered as vineyards are subject to sales where the non-viticultural component (residential, tourist, non-viticultural agricultural) predominates. This dual specificity explains why the DVF database, in its standard processing, struggles to provide a reliable image of the strict Corsican wine market.
Over the H2 2020 – 2025 period, our observatory has retained 17 vineyard transactions in Corsica, an average of less than three transactions per full year. This volume is insufficient to produce robust annual statistics; we publish it for indicative purposes and call for great caution in interpreting the figures below.
| Year | Volume | Average price | Median price |
|---|---|---|---|
| 2020 * | 2 | €42,418/ha | €42,418/ha |
| 2021 | 2 | €29,822/ha | €29,822/ha |
| 2022 | 3 | €22,203/ha | €8,451/ha |
| 2023 | 3 | €14,663/ha | €11,942/ha |
| 2024 | 5 | €26,209/ha | €13,073/ha |
| 2025 | 2 | €26,473/ha | €26,473/ha |
| Total | 17 | €25,828/ha | €24,837/ha |
* 2020: second half only.
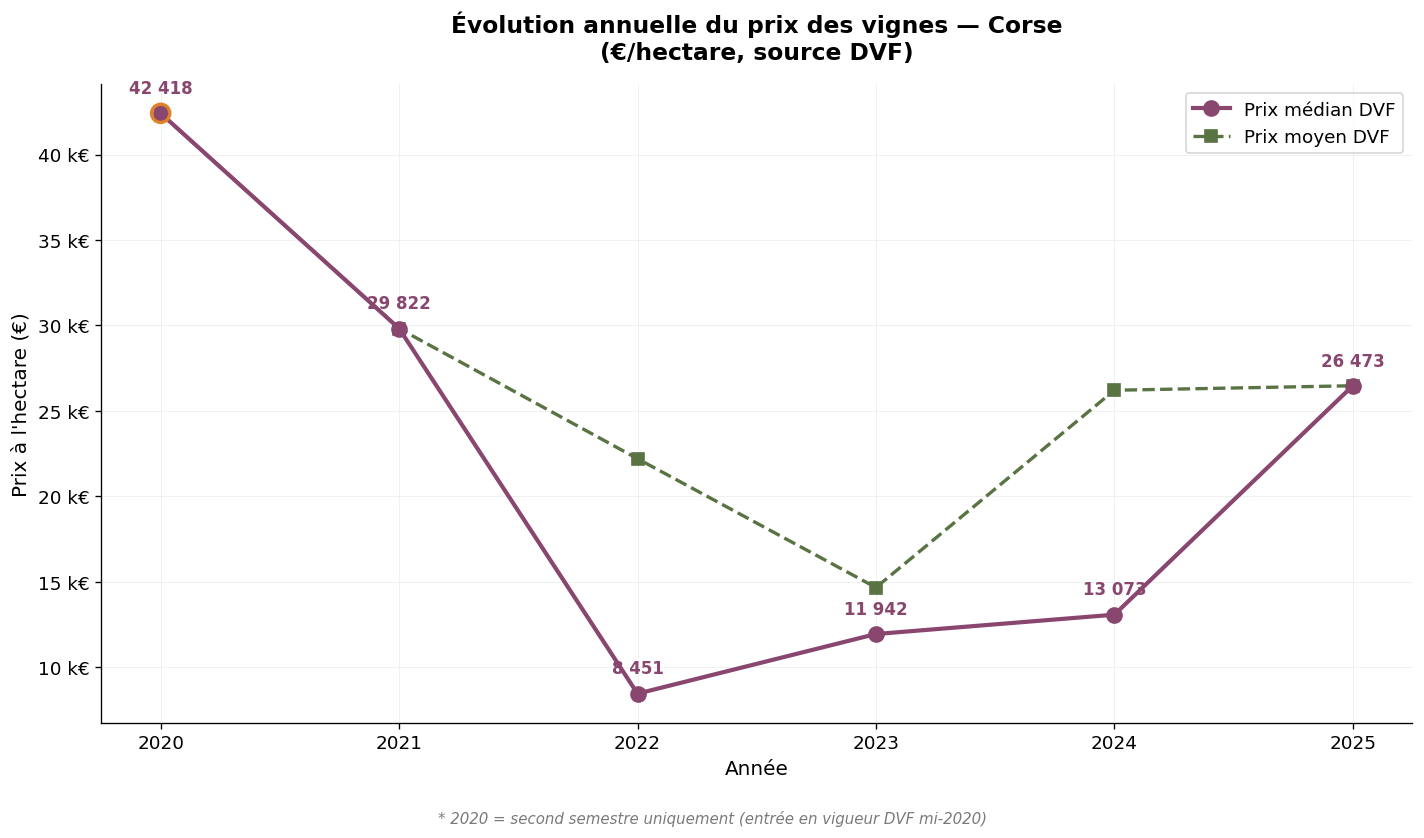
Annual evolution of DVF prices — Corsica — Very small volume, to be interpreted with caution — Source: DVF, ma-propriete.fr processing
The annual trajectory, as it appears in the DVF data, is too volatile to be analytically usable: €42,418/ha in 2020, €8,451/ha in 2022, €13,073/ha in 2024, €26,473/ha in 2025. These variations do not reflect a market dynamic but the extreme sensitivity of indicators to the mix of the two or three transactions recorded each year. All DVF transactions in the Corsican vineyard are located in Haute-Corse (department 2B); no transactions were recorded in Corse-du-Sud (2A) within our filtered scope over the period. For a reliable reading of the island vineyard land market, one must therefore turn to SAFER statistics.
SAFER statistics, published each year by the Ministry of Agriculture, are based on a survey of notaries and a filtering of transactions of more than half a hectare in a single block. For the Corsican vineyard, they constitute the reference and compensate for the limitations of the DVF database.
| Year | Average price (€/ha) | 5-year evolution |
|---|---|---|
| 2000 | 7,098 | — |
| 2005 | 12,050 | + 70 % |
| 2010 | 15,719 | + 30 % |
| 2015 | 21,499 | + 37 % |
| 2020 | 24,000 | + 12 % |
| 2024 | 23,700 | - 1 % |
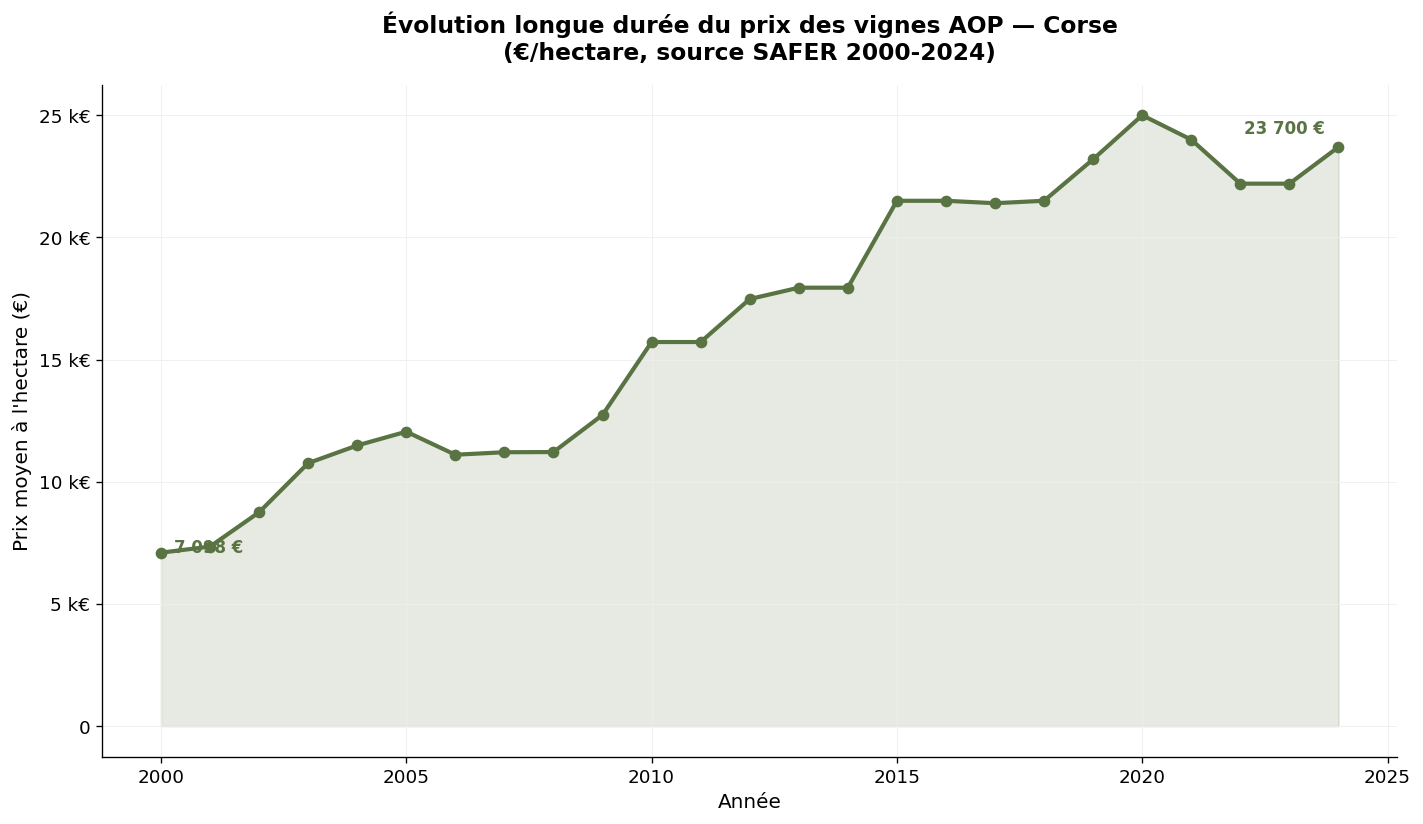
SAFER average price of AOP Corsican vineyards — Source: Ministry of Agriculture / SAFER
Over twenty-five years, the SAFER average price of Corsican vineyards has more than tripled, rising from €7,098/ha in 2000 to €23,700/ha in 2024 (+234%). This is one of the most impressive progressions of French wine land over the long term, comparable to that of Cognac or Burgundy. This dynamic reflects several converging factors: the growing qualitative recognition of Corsican wines since the 2000s, the repositioning of communal appellations (Patrimonio, Ajaccio, Calvi), heritage and tourist pressure on island terroirs, and land scarcity linked to the small size of the vineyard. The very slight discount observed between 2019 and 2024 (-1%) nevertheless confirms a market plateau, at a historically high level.
Given the very low volume of DVF transactions in Corsica (17 over six years), a detailed departmental analysis would be of little informational value. We summarize here the available data for indicative purposes.
All DVF transactions of the Corsican vineyard in our scope are concentrated in Haute-Corse, a department which notably covers the Patrimonio AOC (the most prestigious on the island) and the Vin de Corse-Calvi AOC. Out of the 17 transactions recorded, the median price stands at €24,837/ha and the average at €25,828/ha, levels consistent with the SAFER 2024 average. The maximum observed (€60,000/ha) reflects the land value of the best Patrimonio plots. The average surface area (26,312 m²) is high.
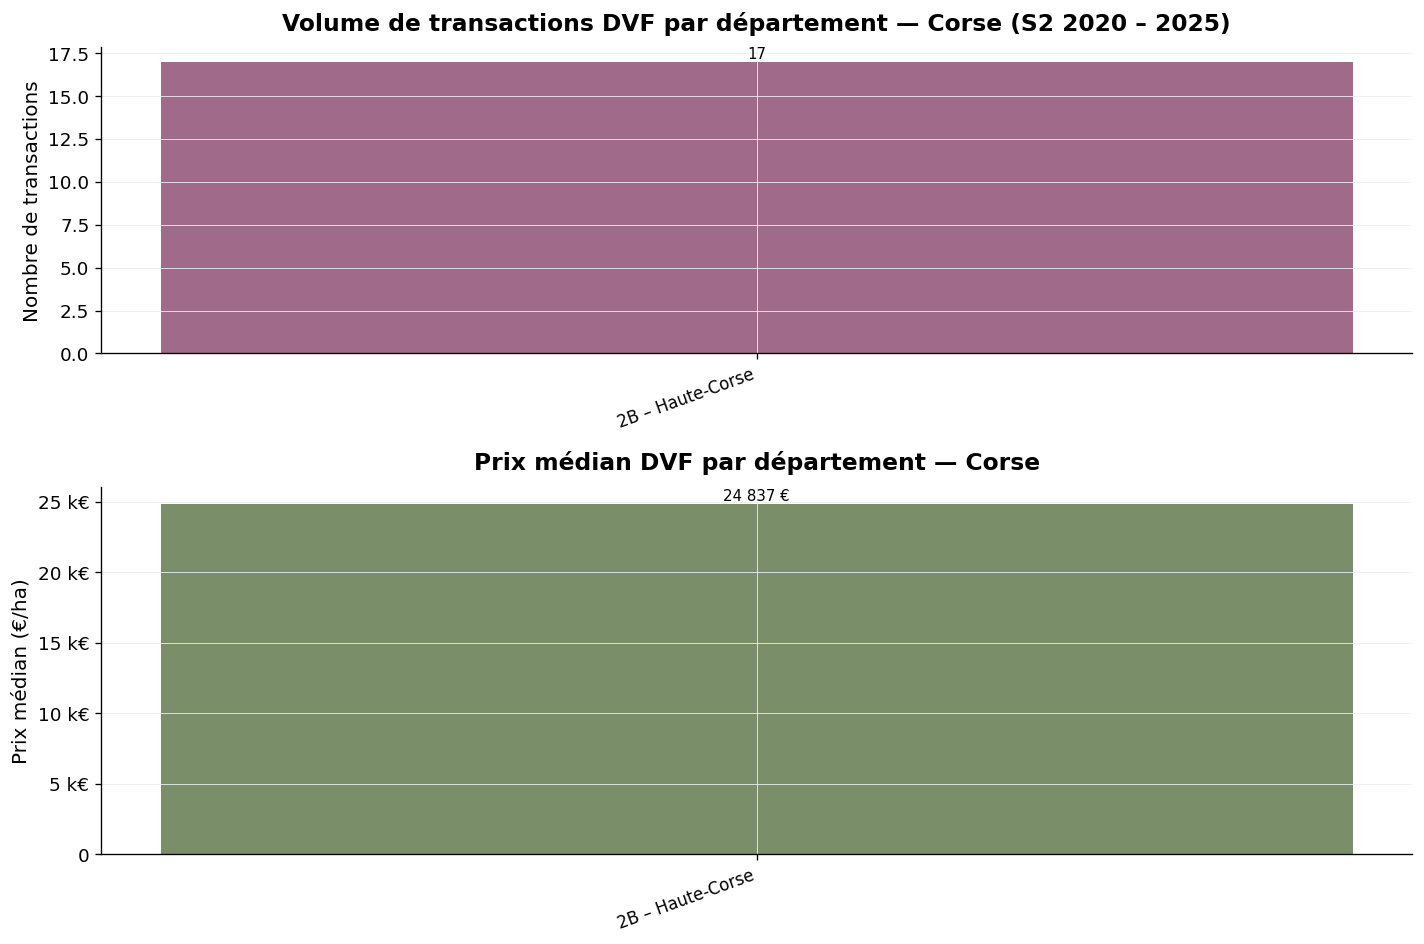
Volume and median price by department — Corsica, H2 2020 – 2025 — Source: DVF, ma-propriete.fr processing
No vineyard transactions were retained by our methodology in Corse-du-Sud (department 2A) over the H2 2020 – 2025 period. This absence does not reflect the non-existence of a market — the Ajaccio AOC, Vin de Corse Sartène AOC, Vin de Corse Figari AOC and Vin de Corse Porto-Vecchio AOC are produced there — but the combined effect of the scarcity of strictly viticultural transactions and the filtering which excludes mixed properties. For a reliable reading of prices in Corse-du-Sud, one should refer to SAFER statistics and local market reports published by the Corsican Chamber of Agriculture.
Beyond the statistical limitations, several structural characteristics deserve to be highlighted. First, tourist and heritage pressure exerts a strong influence on prices: many wine estates are sold with a wine tourism dimension that adds value beyond mere agronomic potential. Next, the reform of the island's land status and the progressive regularization of historical joint ownerships are gradually freeing up plots that have long been untransacted, which could fuel market activity in the years to come. Finally, the qualitative dynamic of the vineyard — concentration on native grape varieties, the upmarket positioning of AOCs, international critical recognition — supports long-term valuation, mirroring the SAFER trajectory 2000-2024.
For interested buyers, Corsica presents an illiquid market but one with strong heritage potential. The scarcity of transactions means operating on opportunities rather than a regular flow of offers: available estates are few and buying competition can be fierce, particularly in Patrimonio. To explore the listings available, consult our vineyard category.
The DVF database lists all real estate transactions for value registered by the DGFiP. To isolate vineyard transactions within this database, our observatory applies several filters: selection of plots registered as "vineyard" in nature, cross-referencing with the INAO repository commune by commune, elimination of atypical transactions (mixed dwelling + vineyard properties, intra-family sales, transfers to companies).
The low volume of strictly viticultural transactions (17 over six years) calls for the greatest caution in interpretation. Several specific factors explain this scarcity. The total surface of the vineyard is small (approximately 6,000 hectares). The island land market frequently combines vineyards and other uses, which leads to excluding these transactions from our scope. The legal regime of Corsican land — historical joint ownerships, titles in the process of regularization — also limits the fluidity of sales. Finally, the year 2020 only covers the second half.
SAFER statistics, published by the Ministry of Agriculture, are based on a survey of notaries and a filtering of transactions of more than half a hectare in a single block. They provide an annual average price over a remarkable historical depth (since 1991). For the Corsican vineyard, they constitute the recommended statistical reference due to the low DVF volume.
| Vineyard | Median price 2025 (€/ha) | Detailed article |
|---|---|---|
| Champagne | 1,000,000 | Champagne |
| Burgundy | 125,000 | Bourgogne-Franche-Comté |
| Savoie | 57,216 | Savoie |
| Provence | 39,864 | Provence |
| Jura | 39,361 | Jura |
| Beaujolais | 39,312 | Beaujolais |
| Cognac | 28,636 | Cognac |
| Rhône Valley | 20,357 | Rhône Valley |
| Loire Valley | 17,000 | Loire Valley |
| Bordeaux | 15,434 | Bordeaux |
| Roussillon | 13,918 | Languedoc-Roussillon |
| Languedoc | 13,531 | Languedoc-Roussillon |
| South-West | 9,205 | South-West |
| Corsica | 26,473 | this article |
Over the 2020-2025 period, the Corsican vineyard presents an atypical wine land market: very low DVF liquidity (only 17 transactions), sustained long-term valuation (+234% over twenty-five years according to SAFER), and a recent plateau at a historically high level (€23,700/ha according to SAFER 2024). The scarcity of transactions and the complexity of island land require giving preference to SAFER statistics for any reliable analysis, and conducting a specific appraisal before any acquisition project. Corsica remains a vineyard with strong heritage potential, particularly in the most recognized AOCs (Patrimonio, Ajaccio), but market access there requires an opportunistic rather than methodical approach. To go further, you can consult our category of vineyard listings, our other articles on vineyard prices or download our white paper dedicated to creating a wine estate.