Updated on May 19, 2026
Stretching nearly one thousand kilometres between the Auvergne region and the Atlantic Ocean, the Loire Valley vineyard is one of the largest and most diverse in France. The fourth largest French vineyard by surface area (approximately 51,000 hectares classified as AOC), it covers nine departments and three major zones — Centre-Loire (Sancerre, Pouilly-Fumé, Reuilly, Quincy, Menetou-Salon), Touraine-Saumur-Anjou (Vouvray, Chinon, Bourgueil, Saumur, Anjou, Coteaux du Layon) and the Nantes Region (Muscadet, Gros Plant) — each representing a distinct land market. Here we analyse the price of wine-growing vineyards in the Loire Valley over the 2020-2025 period, based on DVF (Real Estate Value Requests) data and SAFER references. The 2025 figures, now complete, constitute our main reference year; the 2024 figures provide a robust basis for comparison. The 2025 DVF median price stands at €17,000/ha, confirming the great stability of the Loire market over five years. Note: the year 2020 only covers the second half. This article is part of our observatory on the price of vineyards in France.
Over the H2 2020 – 2025 period, our observatory recorded 1,524 vineyard transactions in the Loire Valley, making it the fourth most active French basin in terms of transaction activity (behind Languedoc, the Rhône Valley and Champagne). The geographical diversity of the vineyard translates into a diversity of price levels: from Muscadet from the Nantes Region at around €7,000-10,000/ha to Sancerre from Cher above €150,000/ha, the range is one of the widest in France.
The average DVF price stands at €32,139/ha and the median price at €16,650/ha. The gap between the average and the median (average = 1.93 × median) reflects the coexistence of high-valuation basins (Centre-Loire) and more modestly valued basins (Nantes Region, Touraine). The median price thus constitutes the most representative indicator of the current market for the typical vineyard visitor.
| Year | Volume | Average price | Median price | Avg. area (m²) |
|---|---|---|---|---|
| 2020 * | 123 | €37,004/ha | €15,000/ha | 19,545 |
| 2021 | 262 | €27,853/ha | €16,089/ha | 17,452 |
| 2022 | 262 | €31,643/ha | €18,000/ha | 21,545 |
| 2023 | 278 | €29,496/ha | €15,280/ha | 20,124 |
| 2024 | 315 | €34,976/ha | €16,287/ha | 16,890 |
| 2025 | 284 | €33,887/ha | €17,000/ha | 14,635 |
* 2020: second half only.
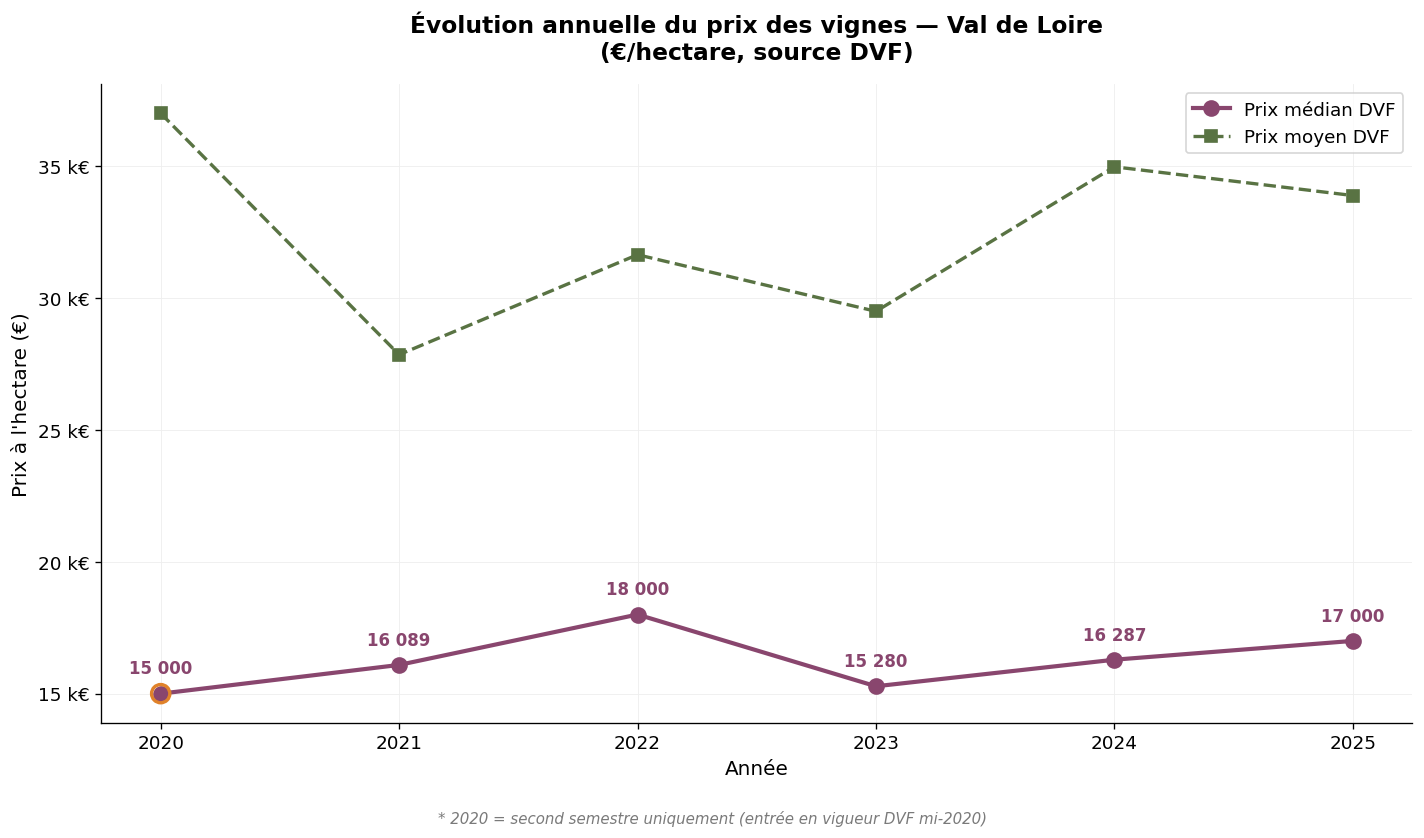
Annual evolution of DVF prices — Loire Valley — Source: DVF, ma-propriete.fr processing
The observation is one of great stability in the median price, which has fluctuated within a narrow range of €15,000 to €18,000/ha over the entire period. The cumulative progression of the median between 2020 and 2025 is approximately 13%, below cumulative inflation over the same period. The average, more volatile, varies according to the relative weight of Sancerre and Pouilly-Fumé transactions from one year to the next. The transaction volume is growing significantly: 315 in 2024 compared to 123 in 2020 (over one half-year), with 2025 activity remaining high (284 transfers).
| Year | Average price (€/ha) | 5-year evolution |
|---|---|---|
| 2000 | 22,129 | — |
| 2010 | 27,465 | + 14 % |
| 2015 | 27,655 | + 1 % |
| 2020 | 35,200 | + 27 % |
| 2024 | 51,000 | + 45 % |
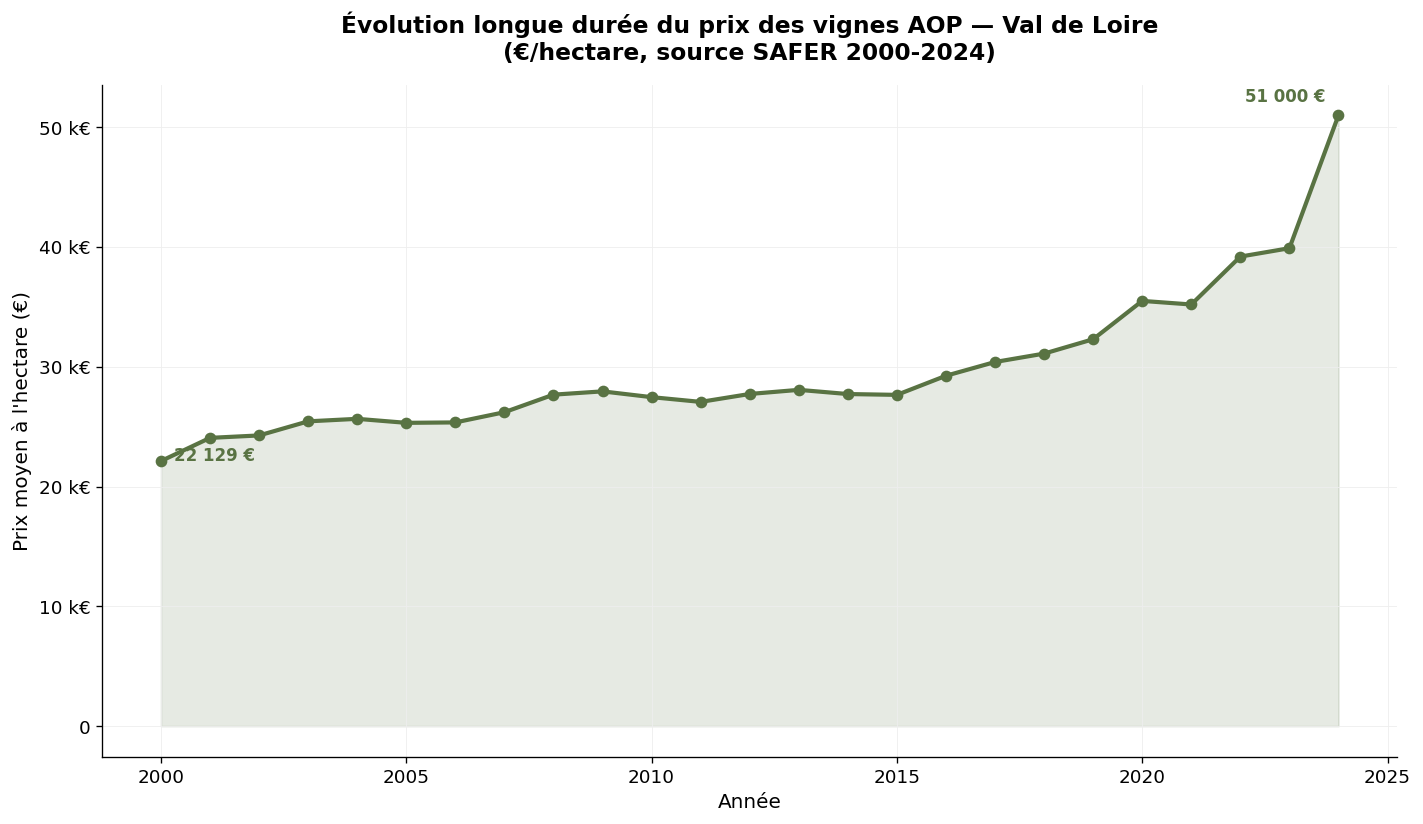
SAFER average price of Loire Valley-Centre PDO vineyards — Source: Ministry of Agriculture / SAFER
Over twenty-five years, the average SAFER price of Loire Valley-Centre vineyards has more than doubled, rising from €22,129/ha in 2000 to €51,000/ha in 2024. The progression was particularly marked between 2019 and 2024 (+45%), driven by the dynamism of Sancerre and Pouilly-Fumé. The gap between the SAFER 2024 average (€51,000/ha) and the DVF 2024 median (€16,287/ha) — more than a factor of 3 — reflects both the diversity of the vineyard and the SAFER weighting which over-represents the higher-value appellations.
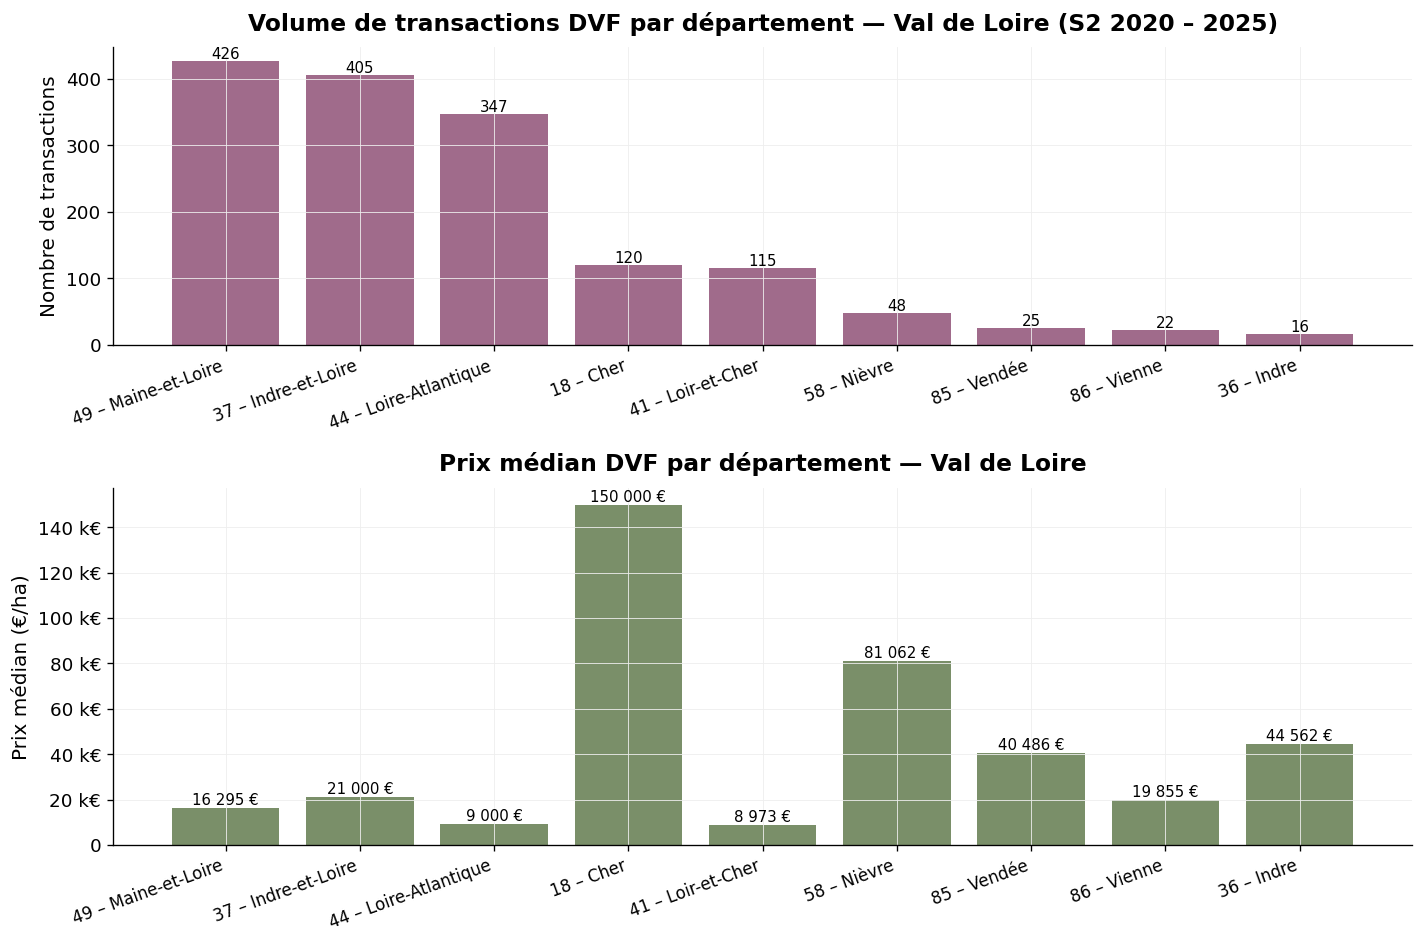
Volume and median price by department — Loire Valley, H2 2020 – 2025 — Source: DVF, ma-propriete.fr processing
The leading department of the vineyard (426 transactions), Maine-et-Loire covers the AOCs Anjou, Saumur, Coteaux du Layon, Bonnezeaux, Quarts-de-Chaume and Savennières. The median price stands at €16,295/ha and the average at €24,649/ha. The average area (20,022 m²) is typical of a vineyard with a strong component of independent farms.
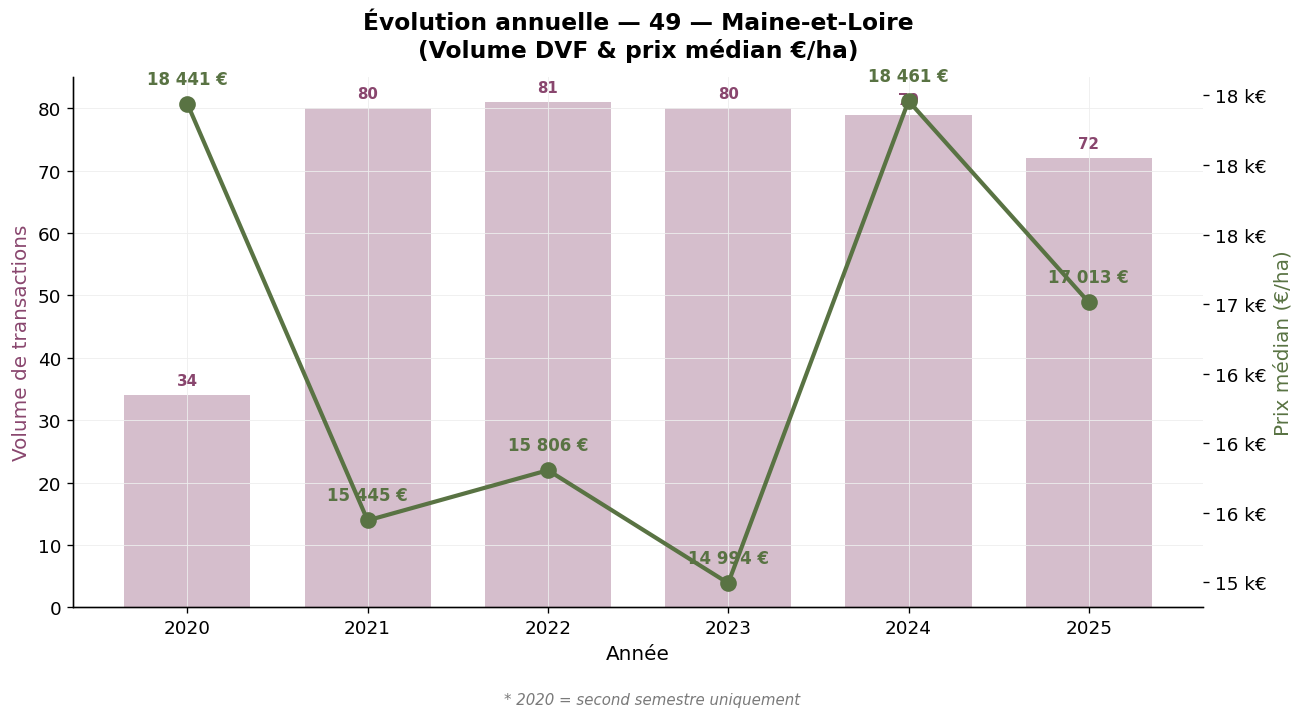
Maine-et-Loire (49) — Annual evolution — Source: DVF, ma-propriete.fr processing
Second department (405 transactions), Indre-et-Loire concentrates the AOCs Vouvray, Montlouis-sur-Loire, Chinon, Bourgueil, Saint-Nicolas-de-Bourgueil, Touraine and Touraine-Amboise. The median price stands at €21,000/ha, the highest among the high-volume departments of the Loire Valley, outside Centre. The average (€23,151/ha) is very close, a sign of a homogeneous market. The trajectory is slightly downward in 2025 (median €17,500/ha compared to €23,010/ha in 2024).
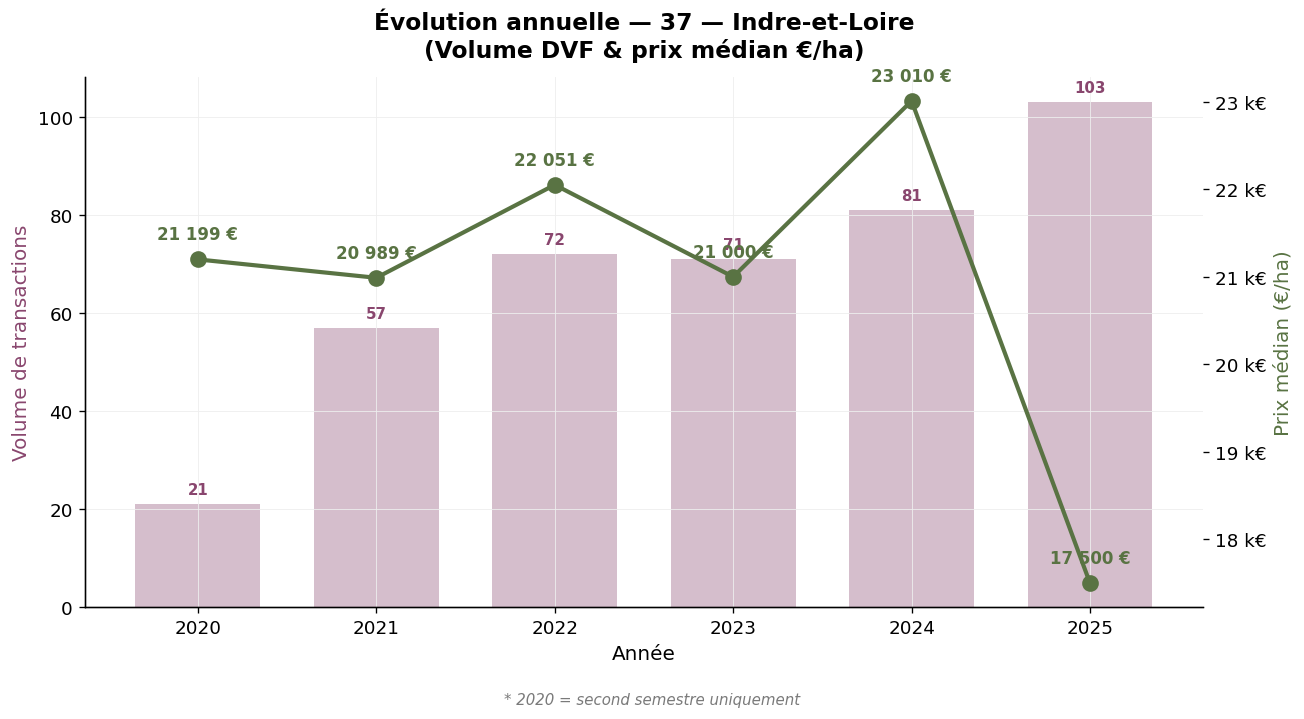
Indre-et-Loire (37) — Annual evolution — Source: DVF, ma-propriete.fr processing
The heart of the Nantes vineyard (347 transactions), Loire-Atlantique is dominated by the AOCs Muscadet, Muscadet-Sèvre-et-Maine, Muscadet-Côtes-de-Grandlieu and Muscadet-Coteaux-de-la-Loire. The median price, €9,000/ha, is one of the lowest in the Loire Valley, reflecting a market in crisis for this grape variety. The average area (25,223 m²) is the highest in the Loire Valley, a sign of a traditionally large farm format.
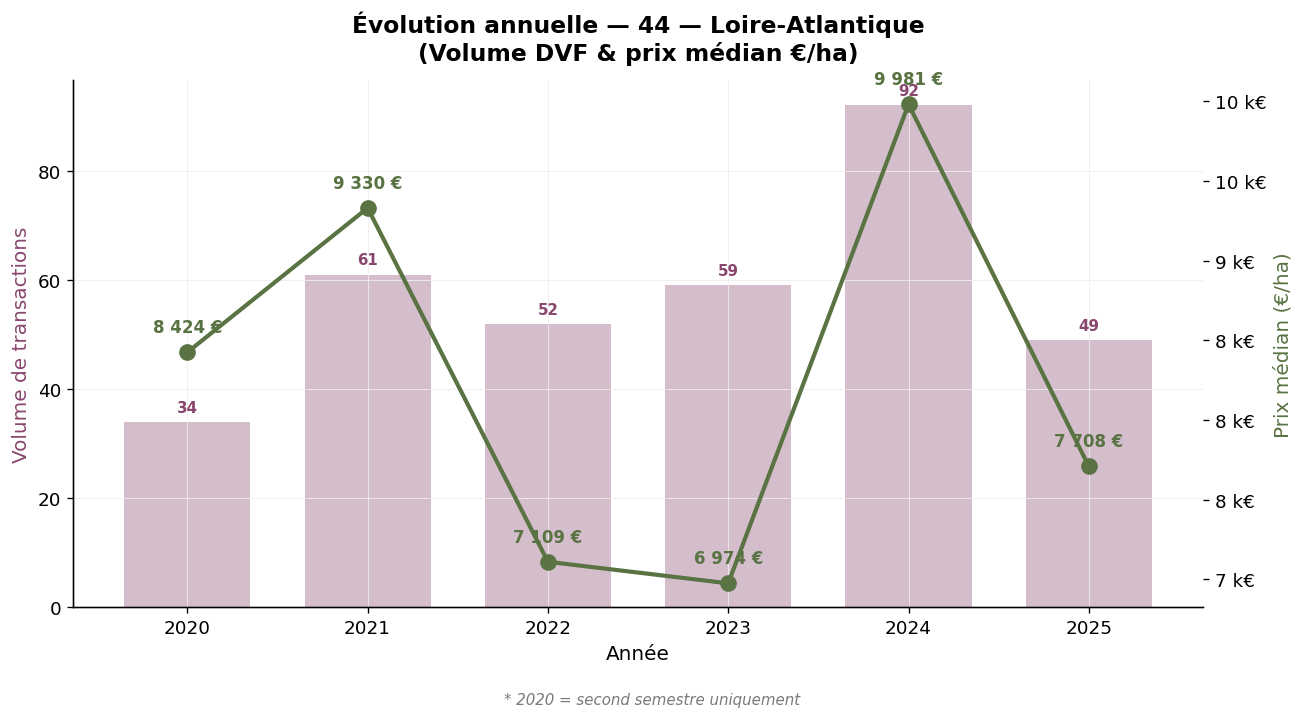
Loire-Atlantique (44) — Annual evolution — Source: DVF, ma-propriete.fr processing
With 120 transactions but a median price of €150,000/ha and an average of €145,560/ha, Cher is the Loire Valley department with the highest valuation. This singularity is explained by the concentration of the Sancerre AOC, one of the most dynamic appellations in France and internationally. The maximum observed (€254,409/ha) confirms the land pressure. The trajectory is upward over the period, with the median rising from €140,000/ha in 2020 to €175,000/ha in 2025 (+25%).
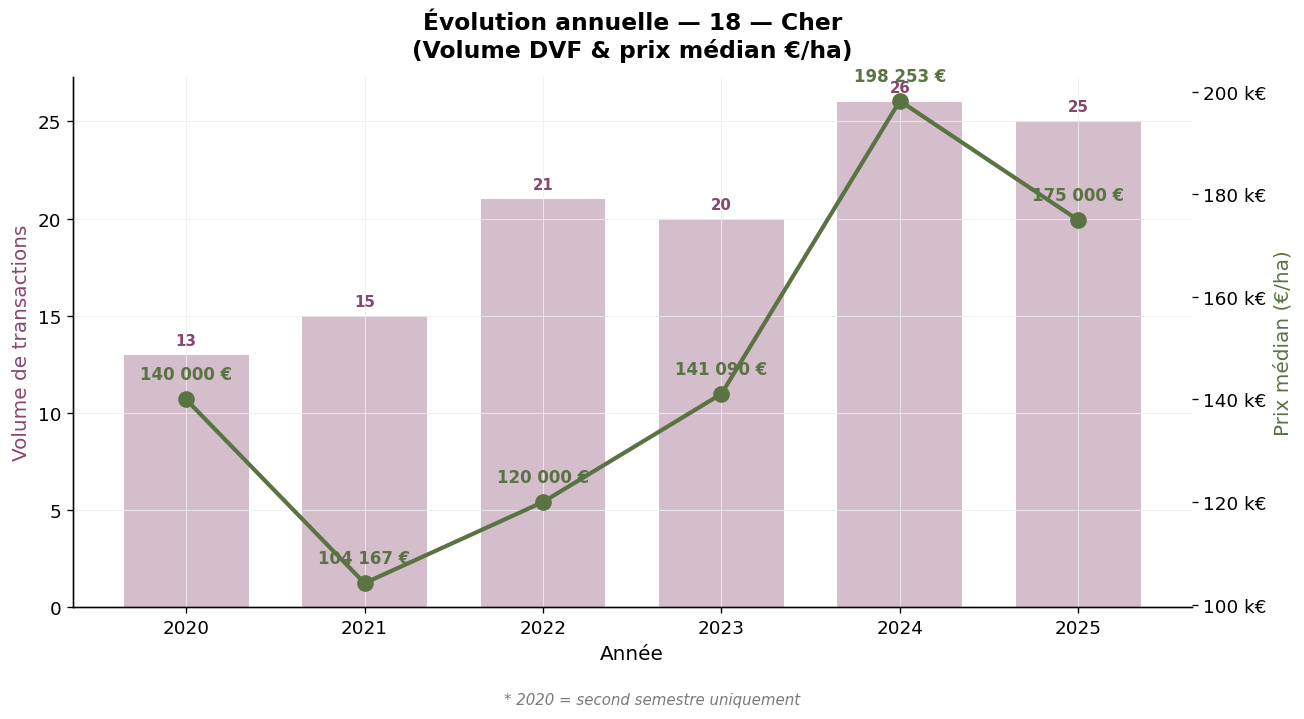
Cher (18) — Annual evolution — Source: DVF, ma-propriete.fr processing
The heart of the Pouilly-Fumé AOC (48 transactions), Nièvre presents a median price of €81,062/ha and an average of €92,310/ha. Although the volume is more limited than in neighbouring Cher, the department benefits from the same Sauvignon dynamism as Sancerre, at slightly lower levels. The 2020-2025 trajectory is solid but marked by variability due to low annual volume.
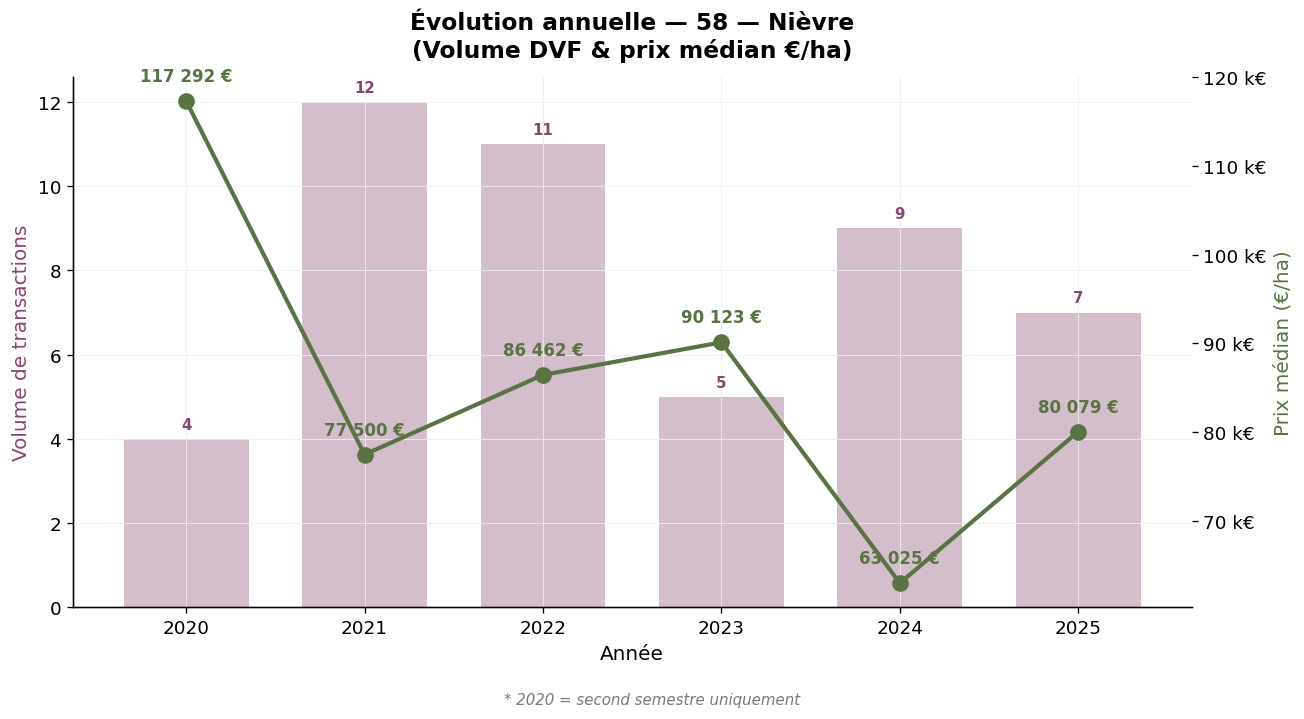
Nièvre (58) — Annual evolution — Source: DVF, ma-propriete.fr processing
The other Loire Valley departments, with more modest volumes, complete the panorama. Loir-et-Cher (41): 115 transactions, median €8,973/ha — one of the lowest in the basin, in the Touraine and Cheverny AOCs. Vendée (85): 25 transactions, median €40,486/ha — small Fiefs Vendéens vineyard. Vienne (86): 22 transactions, median €19,855/ha — Haut-Poitou. Indre (36): 16 transactions, median €44,562/ha — Reuilly and Valençay. The low volume of these departments calls for a cautious interpretation of the annual medians.
The Loire Valley presents a classic seasonality of wine-growing markets: Q1 19.6%, Q2 28.2%, Q3 24.0%, Q4 28.1%. The concentration is shared between the second and fourth quarters, reflecting a logic of accounting finalisation as much as a post-harvest calendar release.
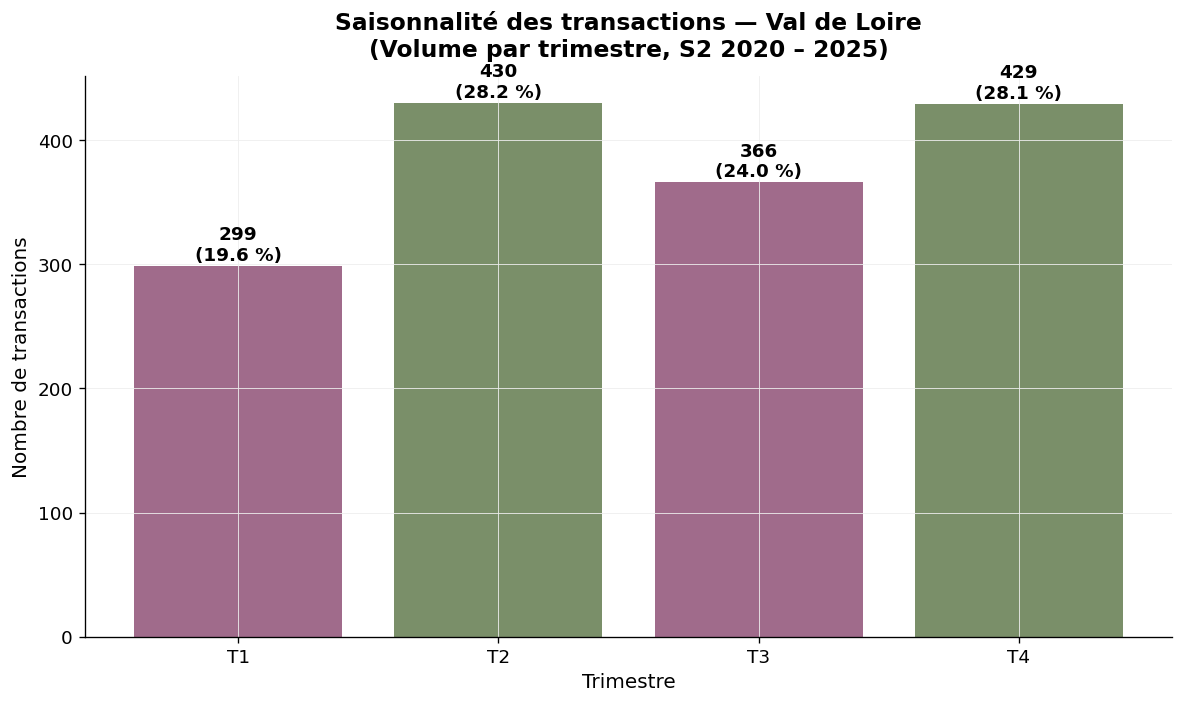
Seasonality — Loire Valley, volume by quarter — Source: DVF, ma-propriete.fr processing
The DVF database lists all real estate transfers for valuable consideration recorded by the DGFiP (French tax authority). To isolate vineyard transactions within this database, our observatory applies several filters: selection of parcels registered as "vineyards", cross-referencing with the INAO directory commune by commune, elimination of atypical transactions (mixed properties dwelling + vineyards, intra-family sales, transfers to companies at convenience prices).
The year 2020 only covers the second half. Mixed properties (vineyards + farm buildings) are excluded when the value of the buildings represents a significant share. The extended geography of the Loire Valley and the diversity of AOCs justify a cautious interpretation of the aggregated averages: departmental or sub-AOC comparisons are more relevant.
SAFER statistics are based on a survey of notaries and a filtering of transactions of more than half a hectare in a single block. They provide an annual average price over a remarkable historical depth (since 1991), aggregated for the entire Loire Valley-Centre region. Our DVF approach complements this view by distinguishing the departments and providing a median price.
| Vineyard | 2025 median price (€/ha) | Detailed article |
|---|---|---|
| Champagne | 1,000,000 | Champagne |
| Burgundy | 125,000 | Burgundy-Franche-Comté |
| Savoy | 57,216 | Savoy |
| Provence | 39,864 | Provence |
| Jura | 39,361 | Jura |
| Beaujolais | 39,312 | Beaujolais |
| Cognac | 28,636 | Cognac |
| Rhône Valley | 20,357 | Rhône Valley |
| Loire Valley | 17,000 | Current article |
| Bordeaux | 15,434 | Bordeaux |
| Roussillon | 13,918 | Languedoc-Roussillon |
| Languedoc | 13,531 | Languedoc-Roussillon |
| South-West | 9,205 | South-West |
Over the 2020-2025 period, the Loire Valley offers one of the most diverse and accessible wine-growing land markets in France. The DVF median price, stable at around €16,000-17,000/ha, nevertheless masks highly contrasting departmental dynamics: Centre-Loire at very high value (Cher, Nièvre above €80,000/ha), Touraine and Anjou at average valuation (€15,000-25,000/ha), Nantes Region with low entry cost (Loire-Atlantique €9,000/ha). The spectacular progression of the SAFER average (+45% over five years) reflects the leverage effect of the Centre-Loire appellations on the overall valuation, even though the DVF median, more representative of the current market, remains stable. For a buyer, the Loire Valley combines accessibility, diversity of possible projects and appellations with strong revaluation potential. To go further, you can consult our category of wine-growing listings, our other articles on the price of vineyards or download our white paper on the creation of a wine estate.