Updated on May 19, 2026
The South-West vineyard is a plural ensemble grouping around a dozen distinct vineyards spread across nearly ten departments, from Périgord to Gascony and from Quercy to Tarn. It is one of the most accessible vineyard land markets in France, but also one of the most contrasted in terms of farm structures and appellations. Here we analyse the price of vineyards in the South-West over the 2020-2025 period, based on DVF data (Land Value Requests) and SAFER references. The 2025 figures, now complete, constitute our main reference year; the 2024 figures provide a robust basis for comparison. The 2025 DVF median price stands at €9,205/ha, the lowest level among the major French vineyards. Note: 2020 only covers the second half of the year. This article is part of our observatory of vineyard prices in France.
The South-West wine region covers a mosaic of appellations: Cahors (Lot), Madiran and Pacherenc-du-Vic-Bilh (Gers, Pyrénées-Atlantiques), Jurançon (Pyrénées-Atlantiques), Gaillac (Tarn), Fronton (Haute-Garonne), Buzet and Côtes du Marmandais (Lot-et-Garonne), Bergerac and Monbazillac (Dordogne), Marcillac and Côtes-de-Millau (Aveyron), Côtes de Saint-Mont (Gers), Floc de Gascogne and Armagnac (Gers and surroundings). With 332 DVF transactions over the period, it is the least liquid French wine basin among the major vineyards, which can be explained by both its modest size and its multi-departmental character which dilutes transactions.
Over the entire H2 2020 – 2025 period, the average DVF price for South-West vineyards stands at €17,076/ha and the median price at €10,435/ha. The South-West median is the lowest of all French vineyards analysed in our observatory. The average, significantly higher (1.64 × median), reflects the presence of some exceptional transactions, particularly in appellations with greater renown (Cahors, Madiran, Jurançon).
| Year | Volume | Average price | Median price | Avg. surface (m²) |
|---|---|---|---|---|
| 2020 * | 35 | €18,237/ha | €13,774/ha | 25,682 |
| 2021 | 63 | €16,900/ha | €11,186/ha | 31,052 |
| 2022 | 61 | €14,885/ha | €10,552/ha | 35,760 |
| 2023 | 61 | €18,045/ha | €12,237/ha | 29,822 |
| 2024 | 55 | €14,018/ha | €8,990/ha | 30,312 |
| 2025 | 57 | €20,817/ha | €9,205/ha | 28,396 |
* 2020: second half only.
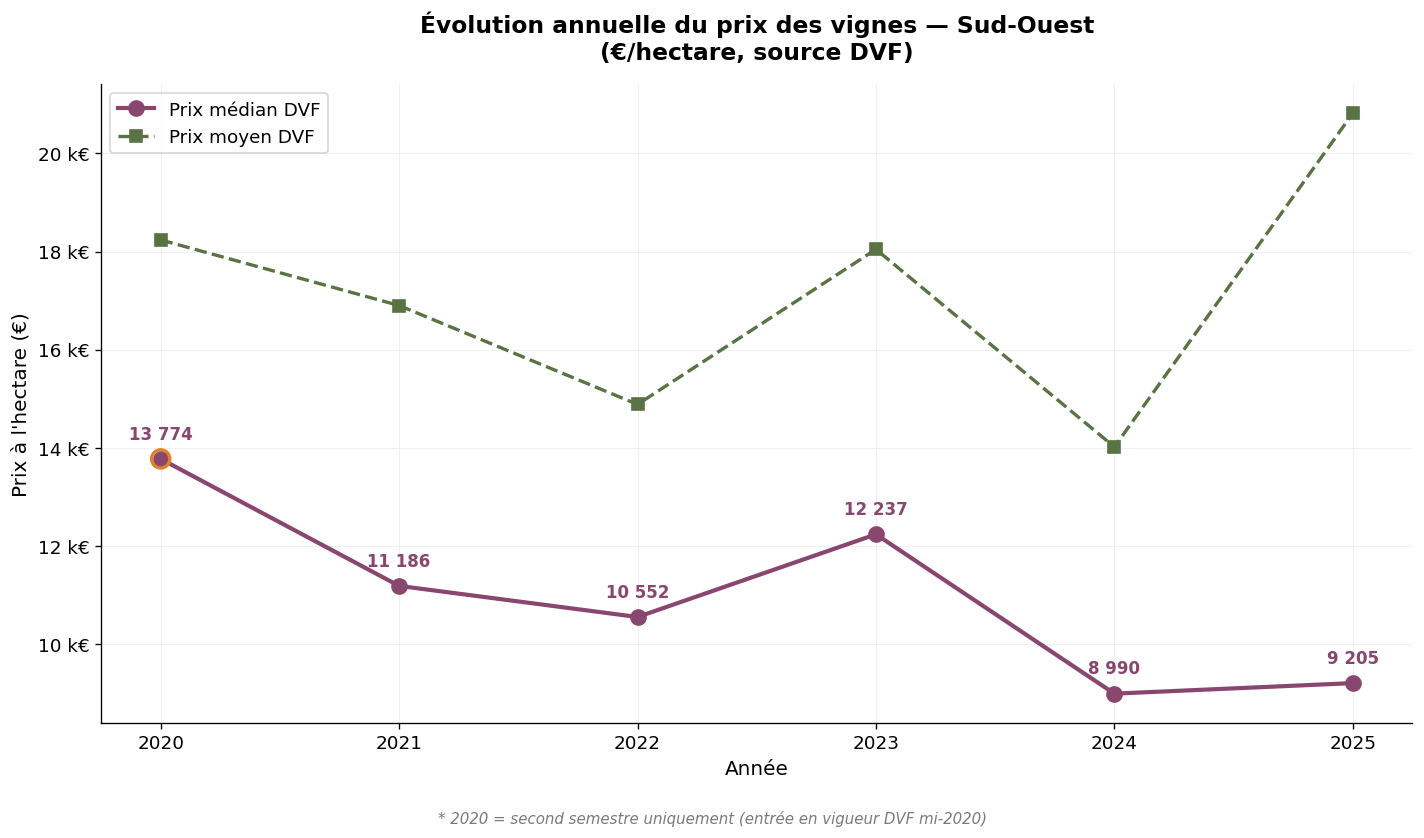
Annual evolution of DVF prices — South-West — Source: DVF, ma-propriete.fr processing
The finding is one of a downward trend in the median price, which lost nearly 33% between 2020 and 2024 (from €13,774 to €8,990/ha) before a slight stabilisation in 2025 at €9,205/ha. This discount on South-West vineyard land accompanies the structural fragility of several appellations facing the contraction of bulk wine prices and the decline in exports. The average surface area transacted is one of the highest in France (around 30,000 m² per transaction), reflecting a vineyard where large-scale farming is dominant, particularly in Gers and Lot-et-Garonne.
| Year | Average price (€/ha) | 5-year change |
|---|---|---|
| 2000 | 16,044 | — |
| 2010 | 13,730 | - 14 % |
| 2015 | 13,711 | stable |
| 2020 | 12,900 | - 6 % |
| 2024 | 13,400 | + 4 % |
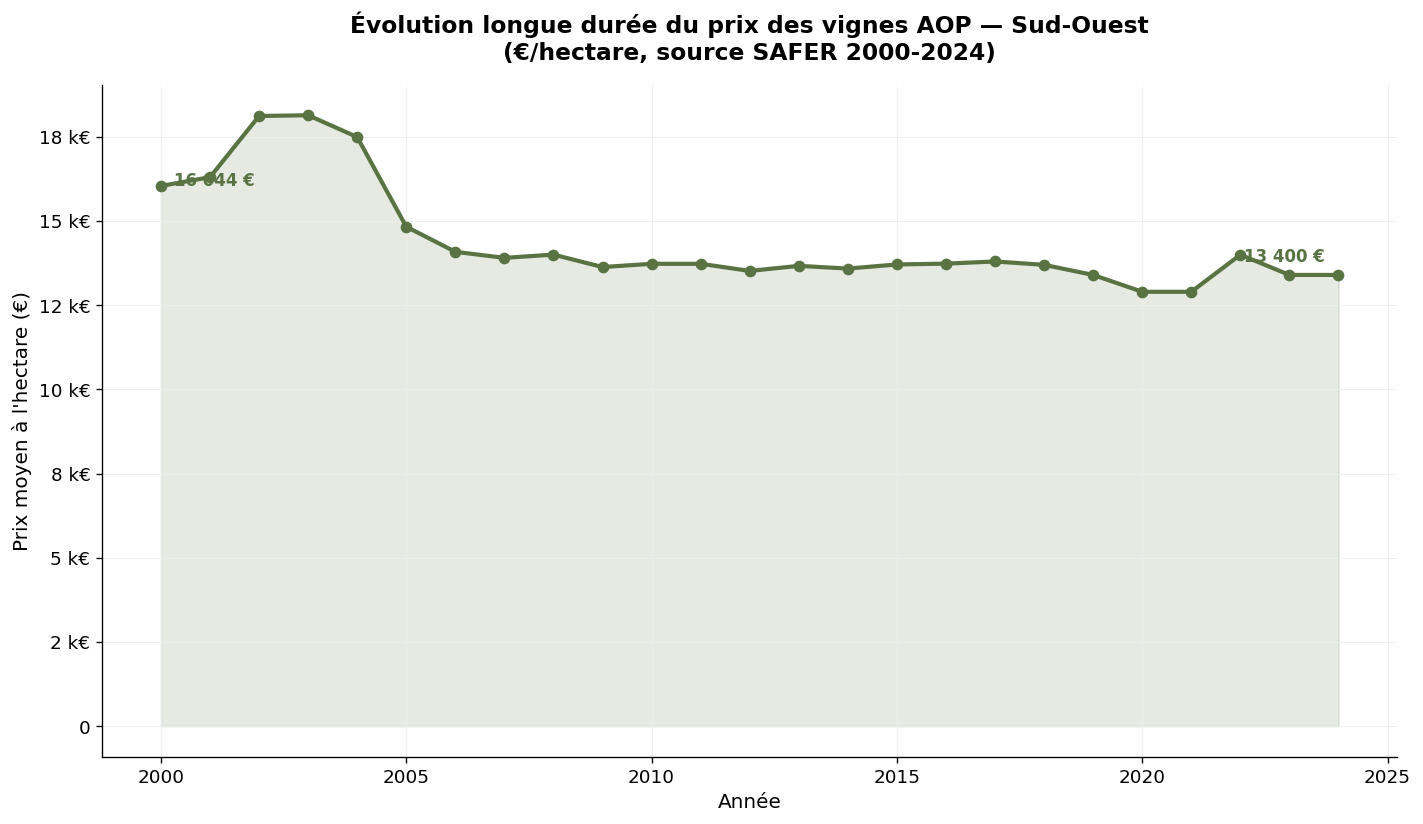
SAFER average price for South-West AOP vineyards — Source: Ministry of Agriculture / SAFER
Over twenty-five years, the SAFER average price for South-West vineyards has fallen from €16,044/ha in 2000 to €13,400/ha in 2024 (-16.5%). It is, along with Languedoc-Roussillon, the most unfavourable SAFER trajectory among the major French vineyards. This long-term evolution reflects the structural difficulties of the South-West basin: narrow export markets compared to Bordeaux, fragmentation of appellations, relatively low international recognition despite the recognised quality of Cahors, Madiran or Jurançon. The very slight recovery observed between 2019 and 2024 (+4%) does not compensate for the long-term discount.
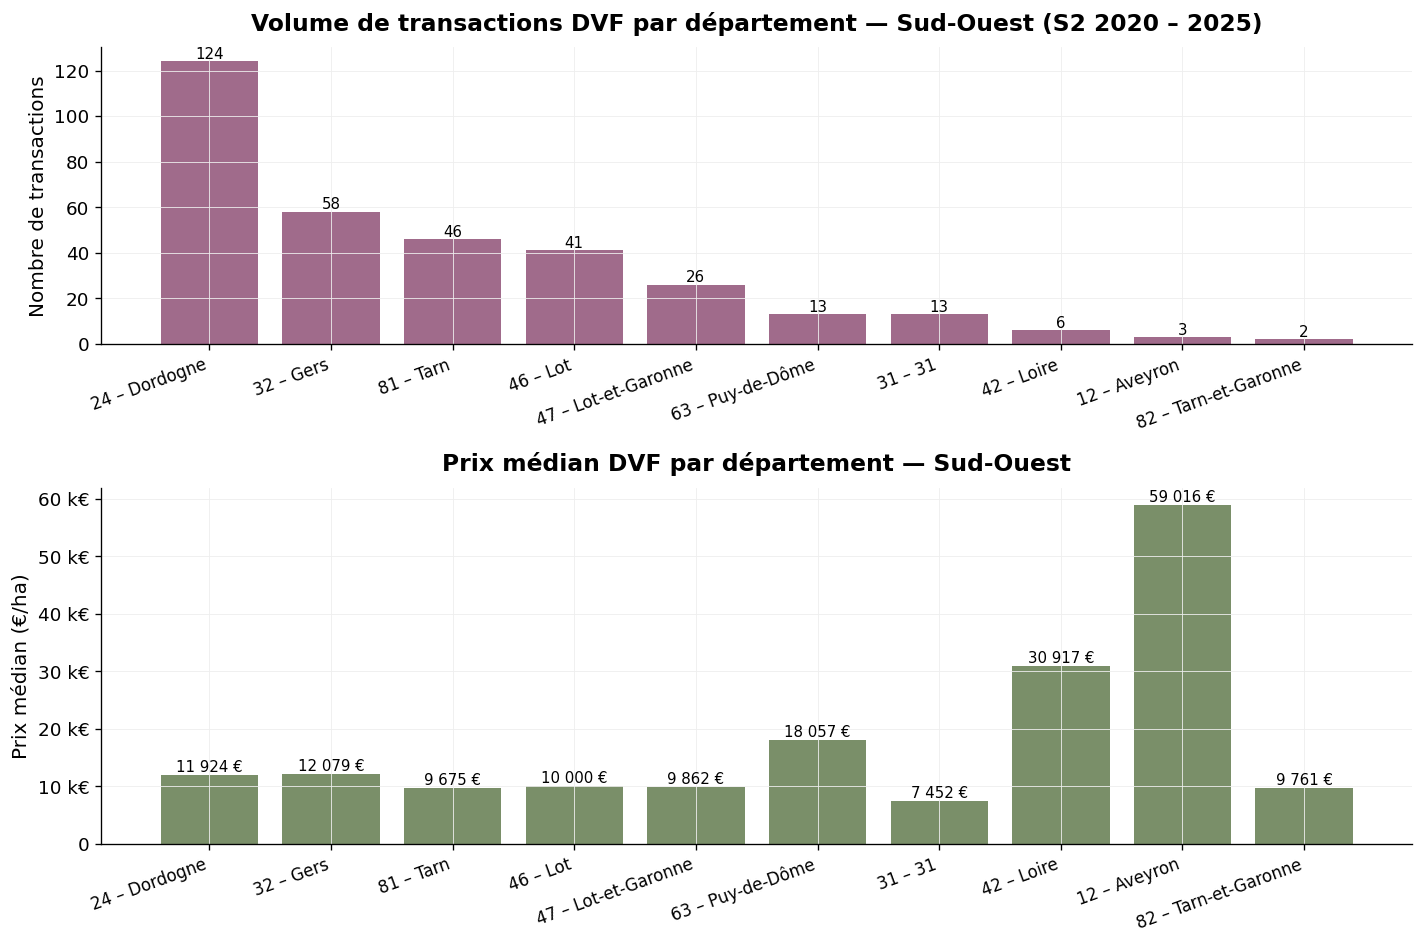
Volume and median price by department — South-West, H2 2020 – 2025 — Source: DVF, ma-propriete.fr processing
The leading department of the South-West basin (124 transactions), Dordogne covers the AOC Bergerac, Pécharmant, Monbazillac, Montravel and Saussignac. The average price stands at €22,966/ha and the median at €11,924/ha. The significant gap reflects the occasional presence of high-value transactions (the maximum reaches €153,423/ha for emblematic plots in Monbazillac or Pécharmant). The average surface (29,803 m²) is high, a sign of a traditionally large farm format.
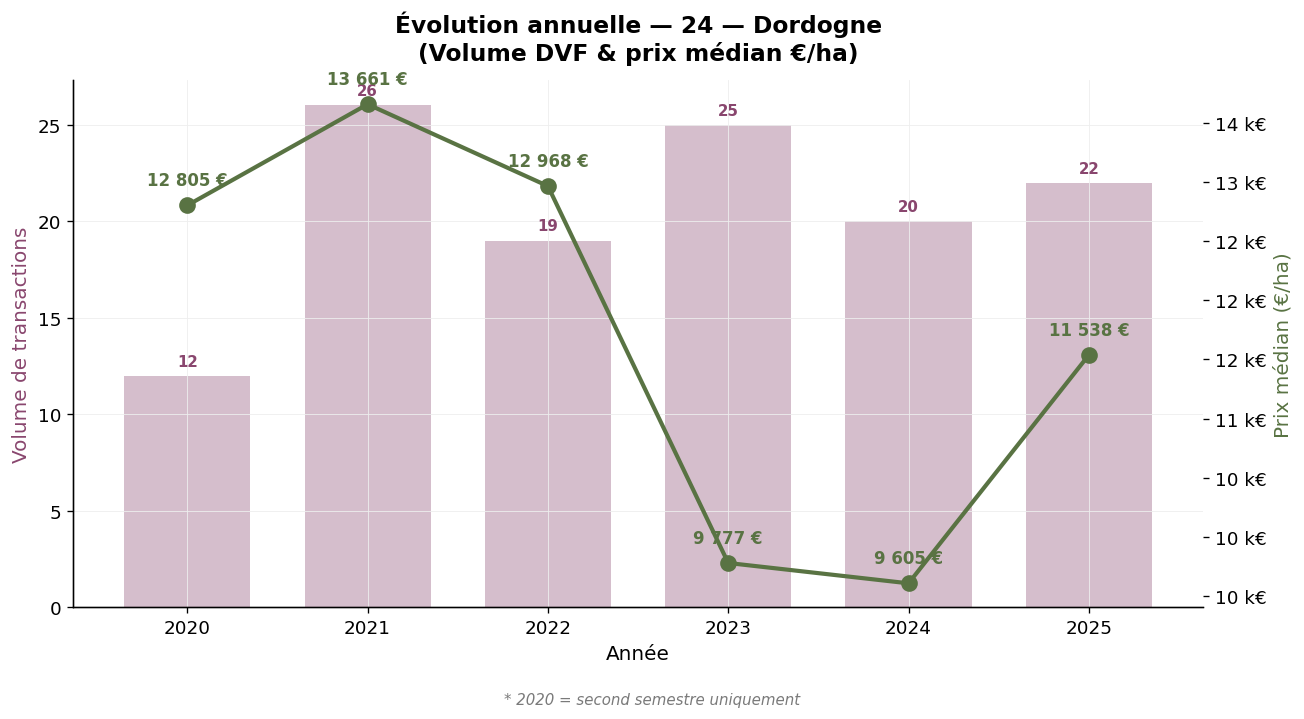
Dordogne (24) — Annual evolution — Source: DVF, ma-propriete.fr processing
The second department (58 transactions), Gers mainly covers the production zones of Armagnac, Floc de Gascogne, Côtes de Saint-Mont, Madiran and Pacherenc-du-Vic-Bilh. The median price stands at €12,079/ha, slightly higher than the basin average. The average surface transacted (46,243 m²) is the highest of all French wine departments, reflecting the dominant large-scale farming format in the production of Armagnac brandy and IGP Côtes de Gascogne wines.
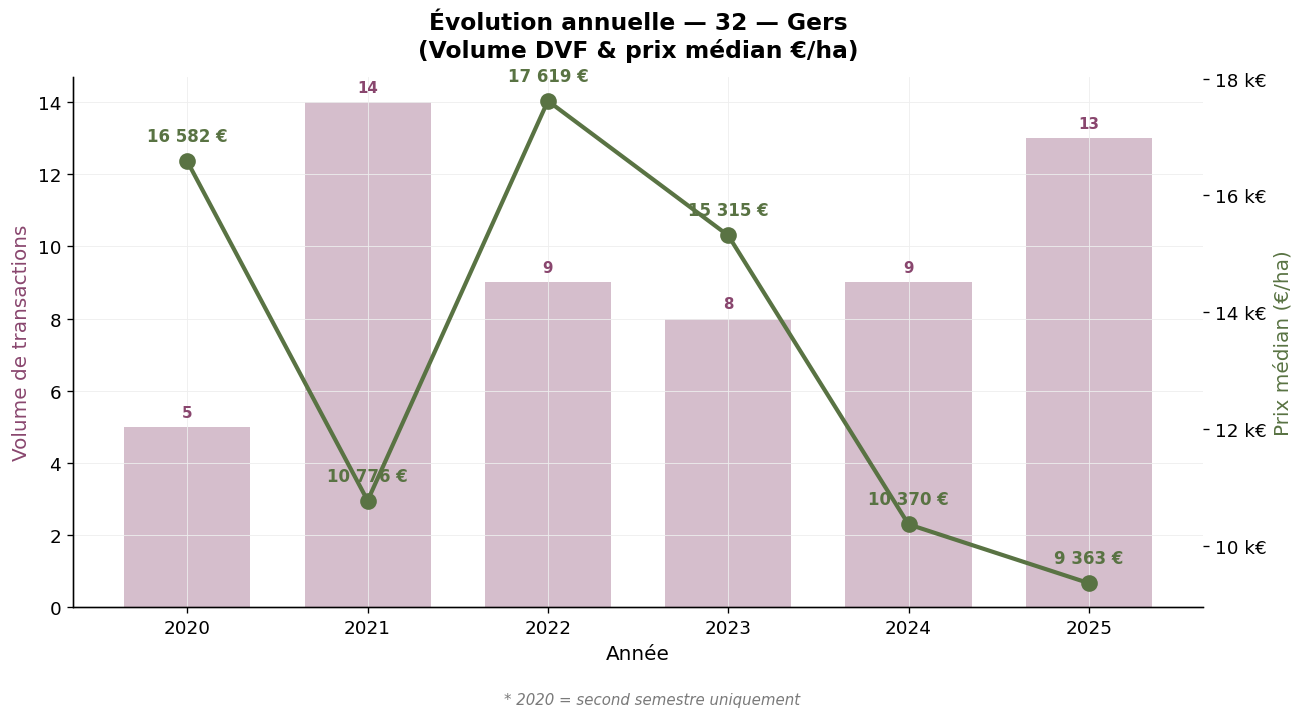
Gers (32) — Annual evolution — Source: DVF, ma-propriete.fr processing
Tarn (46 transactions) concentrates the AOC Gaillac, one of the oldest in France. The median price stands at €9,675/ha, among the lowest in the basin. The average surface (28,127 m²) is consistent with regional practices.
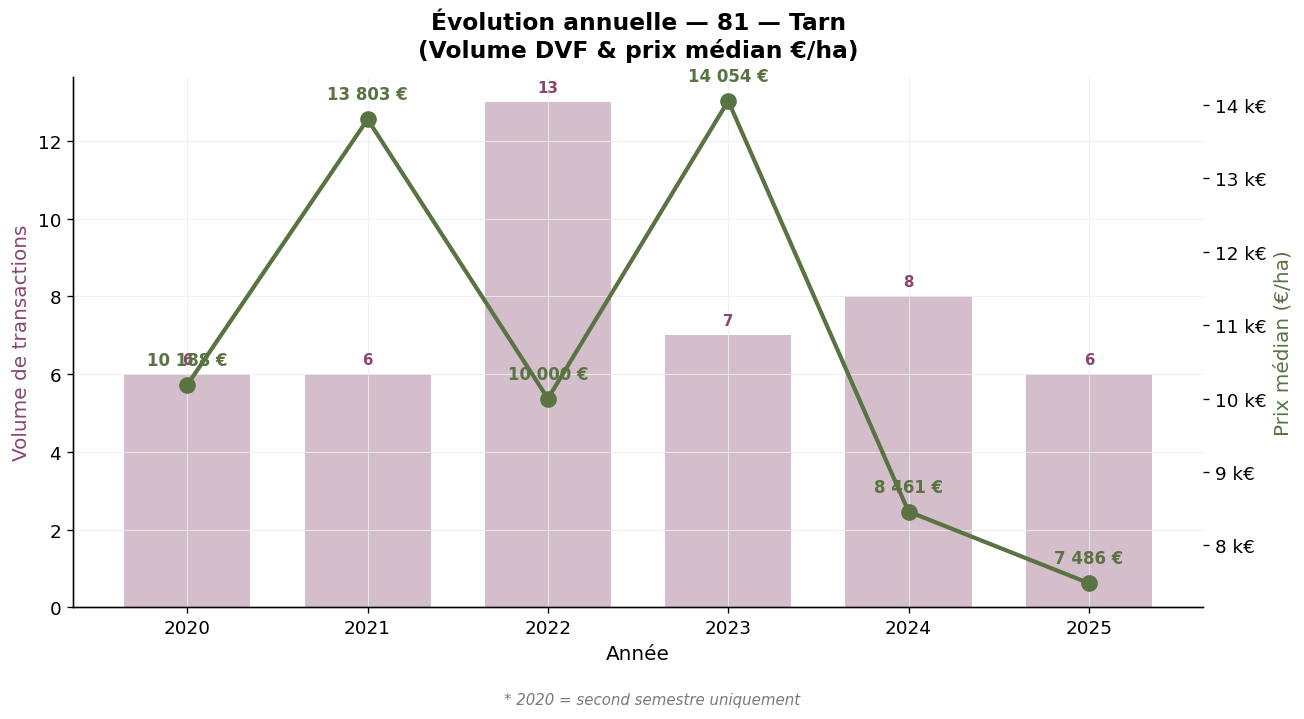
Tarn (81) — Annual evolution — Source: DVF, ma-propriete.fr processing
Lot (41 transactions) is the heart of the AOC Cahors. The median price stands at €10,000/ha, rather modest given the international reputation of the appellation, which nevertheless struggles to fully capitalise on the land market despite the recognised quality of its Malbec. The average surface (18,487 m²) is more contained than in Gers.
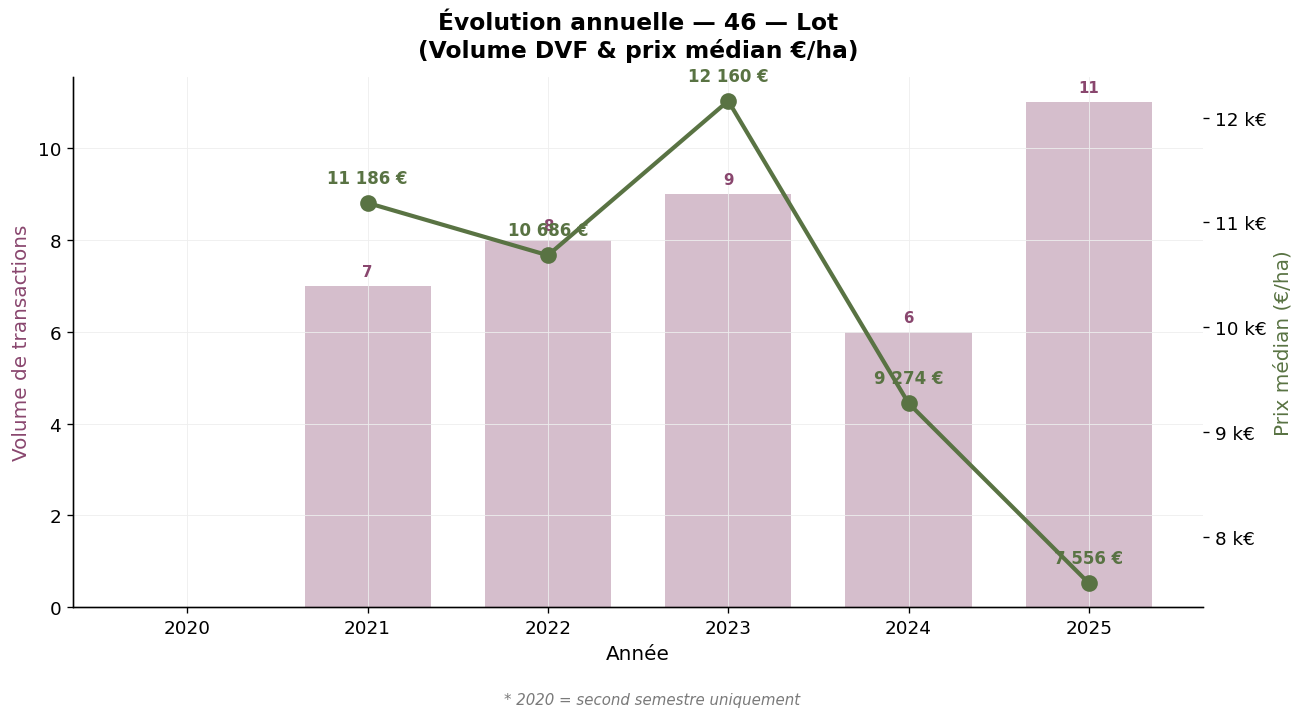
Lot (46) — Annual evolution — Source: DVF, ma-propriete.fr processing
Lot-et-Garonne (26 transactions) covers the AOC Buzet, Côtes du Marmandais and Côtes de Duras. The median price, €9,862/ha, and the average (€10,619/ha) reflect a market under downward pressure. The average surface (40,333 m²) is very high.
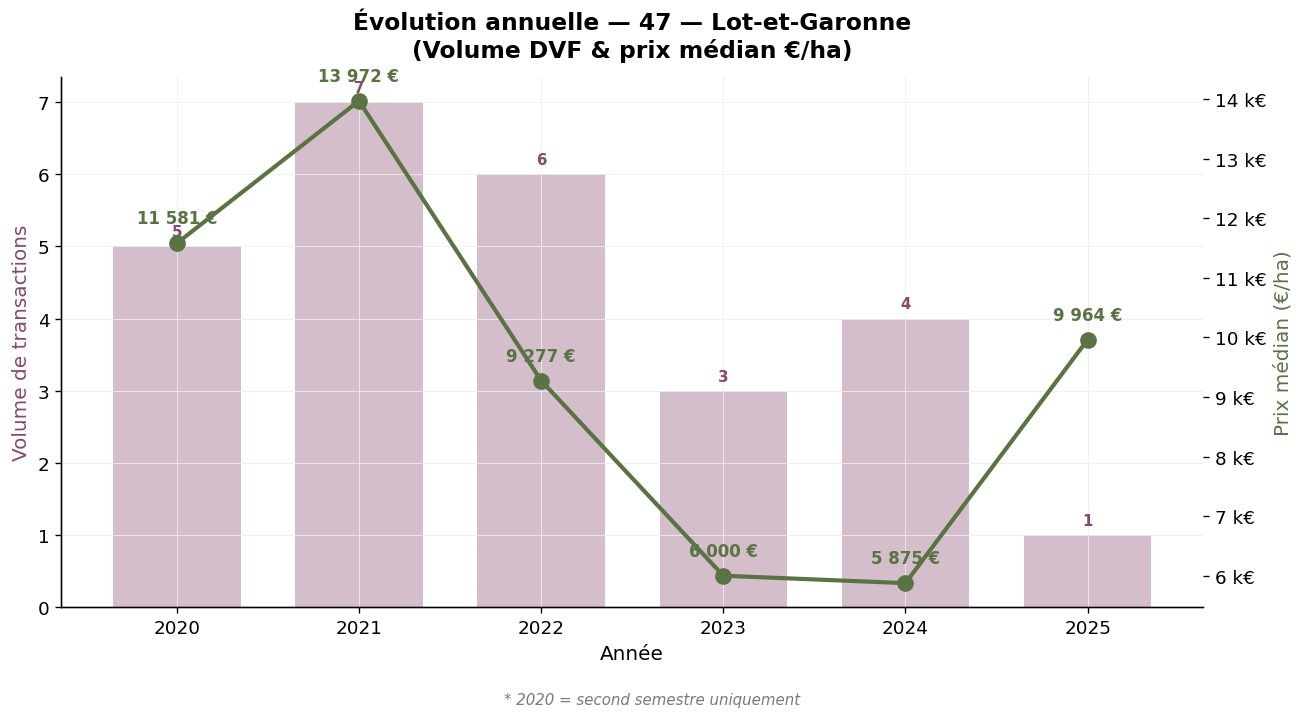
Lot-et-Garonne (47) — Annual evolution — Source: DVF, ma-propriete.fr processing
The other South-West departments show more modest volumes, which warrant a cautious interpretation. Puy-de-Dôme (63): 13 transactions, median €18,057/ha, on the Auvergne vineyards (Côtes d'Auvergne, partly Saint-Pourçain). Haute-Garonne (31): 13 transactions, median €7,452/ha, AOC Fronton. Aveyron (12): 3 transactions, median €59,016/ha, AOC Marcillac. Tarn-et-Garonne (82): 2 transactions, regional IGPs. Loire (42): 6 transactions on the AOC Côtes-du-Forez, median €30,917/ha. These levels should be interpreted with caution due to the low volume.
The basin shows a balanced seasonality: Q1 22.3%, Q2 24.4%, Q3 26.8%, Q4 26.5%. The concentration in the second half of the year remains moderate, a sign of a market with limited but year-round liquidity.
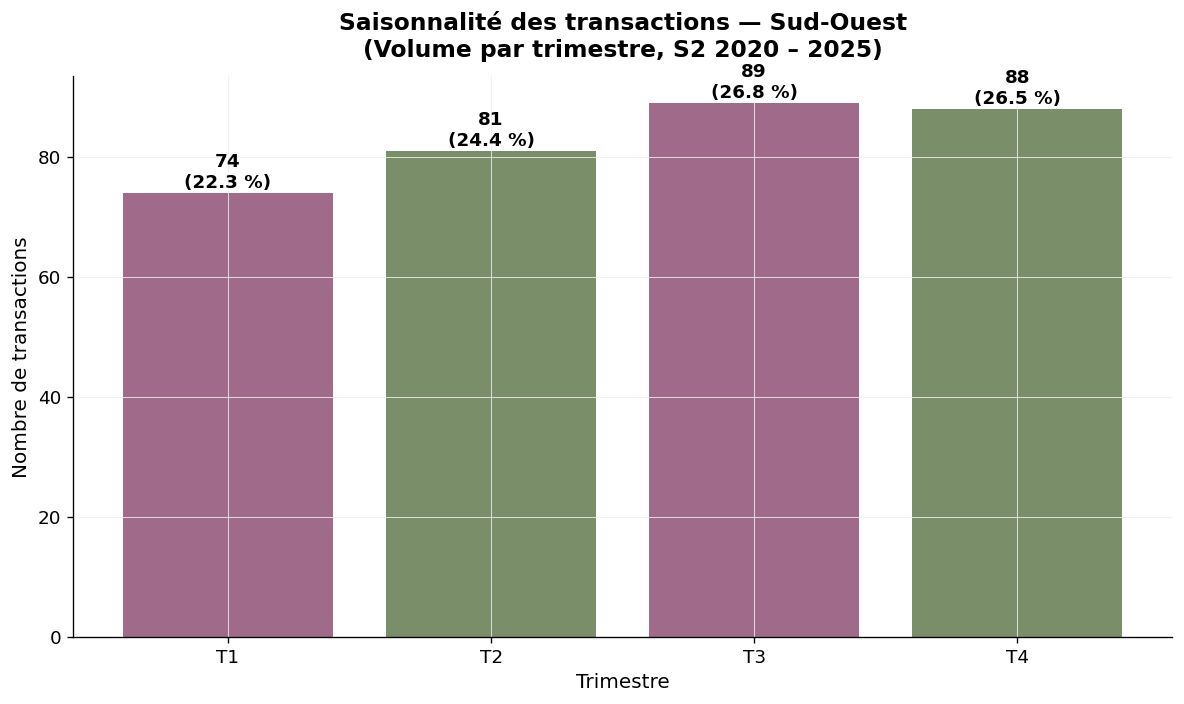
Seasonality — South-West, volume by quarter — Source: DVF, ma-propriete.fr processing
The DVF database lists all real estate transactions for valuable consideration recorded by the DGFiP. To isolate vineyard transactions within this base, our observatory applies several filters: selection of plots registered as "vineyards" in the land register, cross-referencing with the INAO repository commune by commune, elimination of atypical transactions.
The year 2020 only covers the second half. Mixed properties (vineyards + farm buildings) are excluded when the value of the buildings represents a significant share. The low volume of the South-West (332 transactions over six years) calls for cautious interpretation, particularly at the departmental level or for departments with very small volumes.
SAFER statistics, published by the Ministry of Agriculture, are based on a survey of notaries and filtering of transactions of more than half a hectare in one block. They provide an annual average price over a remarkable historical depth (since 1991), aggregated for the entire South-West. Our DVF approach complements this view by distinguishing departments and providing a median price, more representative of the current market.
| Vineyard | 2025 median price (€/ha) | Detailed article |
|---|---|---|
| Champagne | 1,000,000 | Champagne |
| Burgundy | 125,000 | Bourgogne-Franche-Comté |
| Savoie | 57,216 | Savoie |
| Provence | 39,864 | Provence |
| Jura | 39,361 | Jura |
| Beaujolais | 39,312 | Beaujolais |
| Cognac | 28,636 | Cognac |
| Rhône Valley | 20,357 | Rhône Valley |
| Loire Valley | 17,000 | Loire Valley |
| Bordeaux | 15,434 | Bordeaux |
| Roussillon | 13,918 | Languedoc-Roussillon |
| Languedoc | 13,531 | Languedoc-Roussillon |
| South-West | 9,205 | Current article |
The South-West constitutes, over the 2020-2025 period, the most accessible vineyard land market in France, with a DVF median price below €10,000/ha. This financial accessibility should not mask an unfavourable long-term dynamic: the SAFER average price has been falling for twenty-five years, and the DVF median has dropped by 33% between 2020 and 2024 before a slight stabilisation in 2025. Dordogne and Gers structure the transactional activity, with Lot and Tarn completing the panorama with their historic appellations (Cahors, Gaillac). For a buyer, the South-West can represent an interesting entry point provided there is a structuring project: qualitative repositioning of an existing farm, vertical integration with a trading business, or diversification into wine tourism. Without this lever, simple land acquisition offers little prospect of revaluation over five to ten years. To go further, you can consult our category of vineyard listings, our other articles on vineyard prices or download our white paper dedicated to creating a wine estate.