Last updated on May 19, 2026
From Vienne to Avignon, the Rhône Valley vineyard is the second largest French AOC vineyard by area and one of the most liquid land markets in the country. It combines two regions with very different dynamics: a northern valley with very high land value (Côte-Rôtie, Hermitage, Condrieu) and a southern valley structured around the Côtes du Rhône AOC and its local crus (Châteauneuf-du-Pape, Gigondas, Vacqueyras, Cairanne…). We analyse here the price of wine-growing vineyards in the Rhône Valley over the 2020-2025 period, based on DVF (Real Estate Value Requests) data and SAFER references. The 2025 figures, now complete, constitute our main reference year; the 2024 figures provide a robust basis for comparison. The 2025 DVF median price stands at €20,357/ha, extending the remarkable stability observed since 2020. Please note: the year 2020 covers only the second half. This article is part of our observatory of vineyard prices in France.
The vineyard covers approximately 70,000 hectares planted in AOC, mainly distributed between Vaucluse, Gard (AOC Rhône part), Drôme and Ardèche, and more marginally Loire and Rhône. Our observatory records 3,179 DVF transactions over the H2 2020 – 2025 period, making it the most active region by volume after Languedoc.
Over the entire period, the DVF average price stands at €65,787/ha and the median price at €20,844/ha. The gap between average and median (3.16×) reflects the coexistence of two markets: the northern crus (Côte-Rôtie, Hermitage, Condrieu) where transactions frequently exceed €500,000/ha, and the vast base of regional Côtes du Rhône and southern villages where the median stands around €15,000-25,000/ha.
| Year | Volume | Average price | Median price | Avg. area (m²) |
|---|---|---|---|---|
| 2020 * | 328 | €56,863/ha | €20,828/ha | 12,594 |
| 2021 | 577 | €75,548/ha | €20,000/ha | 12,467 |
| 2022 | 635 | €69,655/ha | €21,622/ha | 13,104 |
| 2023 | 532 | €73,189/ha | €23,108/ha | 14,377 |
| 2024 | 563 | €63,129/ha | €20,376/ha | 14,291 |
| 2025 | 544 | €51,814/ha | €20,357/ha | 16,135 |
* 2020: second half only.
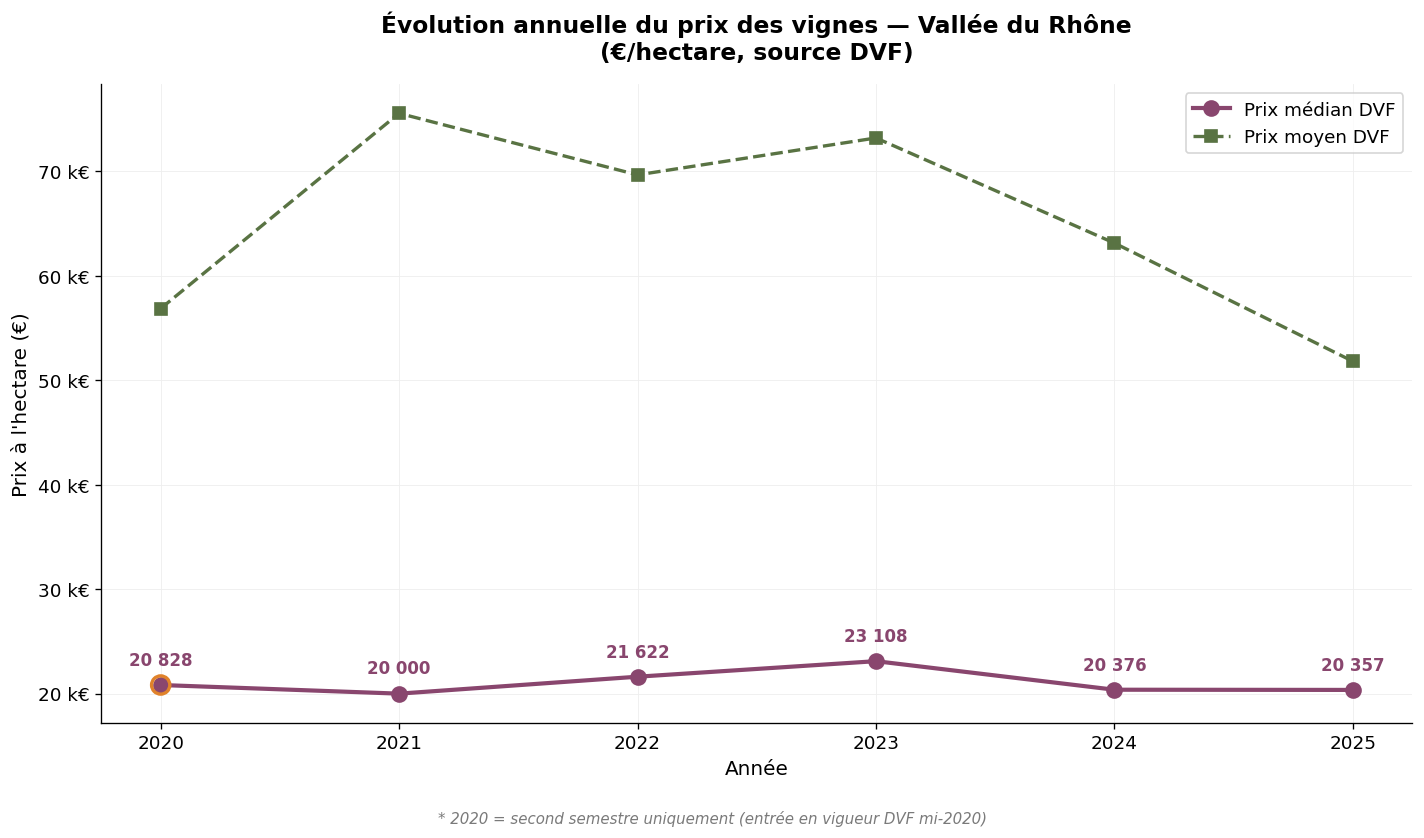
Annual evolution of DVF prices — Rhône Valley — Source: DVF, ma-propriete.fr analysis
The main finding is that of great stability of the median price, which has fluctuated between €20,000 and €23,000/ha over the entire period. The average, more volatile, reflects the variable weight of exceptional transactions in northern crus. The drop in the average in 2025 (€51,814/ha versus €63,129/ha in 2024, i.e. -18%) should be interpreted as a transaction mix effect rather than as a market discount: the median remained perfectly stable at €20,357/ha. The average area (16,135 m² in 2025, up from 12,594 m² in 2020) reflects the listing of larger plots on the market.
SAFER publishes aggregated statistics for the "Rhône Valley-Provence" region, which includes Provence in its scope. Over the long term, the evolution is as follows.
| Year | Average price (€/ha) | 5-year change |
|---|---|---|
| 2000 | 31,476 | — |
| 2010 | 36,827 | + 17% |
| 2015 | 41,836 | + 14% |
| 2020 | 51,400 | + 23% |
| 2024 | 58,700 | + 14% |
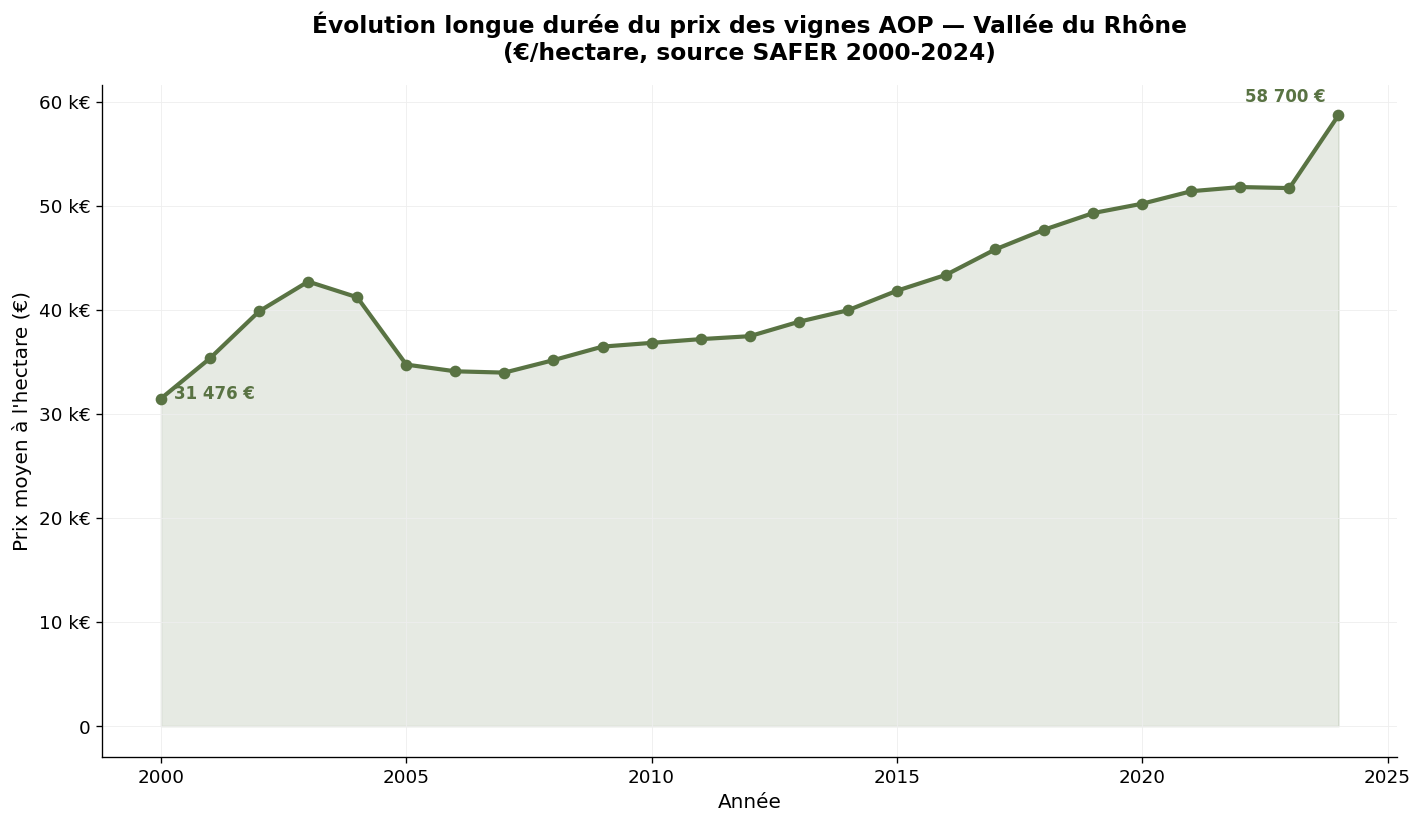
SAFER average price of PDO vineyards in Rhône Valley-Provence — Source: Ministry of Agriculture / SAFER
Over twenty-five years, the SAFER average price for the Rhône Valley-Provence region has increased by 87%, a pace close to the national average. The dynamic is steady, without major jolts. The 14% increase observed between 2019 and 2024 confirms the solidity of the region in the face of turbulence in the French wine industry. Please note: the SAFER average includes Provence, whose levels are higher; for the Rhône Valley alone, it can be estimated that historical levels are approximately 15-20% lower than the consolidated SAFER averages.
The expression "Rhône Valley" actually covers two distinct vineyards, separated by approximately 200 kilometres and characterised by different grape varieties, climates and plot structures.
The northern Rhône Valley (Côte-Rôtie, Condrieu, Saint-Joseph, Hermitage, Crozes-Hermitage, Cornas, Saint-Péray) covers approximately 4,000 hectares in Loire, Ardèche and Drôme. Characterised by the Syrah grape variety for reds and Viognier or Marsanne-Roussanne for whites, it produces sought-after vintage wines. Land pressure is intense: DVF medians frequently exceed €150,000/ha, with maxima above €500,000/ha for the best plots of Côte-Rôtie or Hermitage.
The southern Rhône Valley (Châteauneuf-du-Pape, Gigondas, Vacqueyras, Vinsobres, Rasteau, Cairanne, Lirac, Tavel, Côtes du Rhône Villages and regional Côtes du Rhône) covers approximately 66,000 hectares, mainly in Vaucluse and Gard. It is dominated by black Grenache, blended with Syrah and Mourvèdre for reds and rosés, and by the white grape varieties Grenache blanc, Clairette and Viognier for whites. The land market is more accessible there: the median for regional Côtes du Rhône is around €15,000-20,000/ha, rises to €30,000-40,000/ha in Côtes du Rhône Villages, and can reach €200,000-400,000/ha in Châteauneuf-du-Pape.
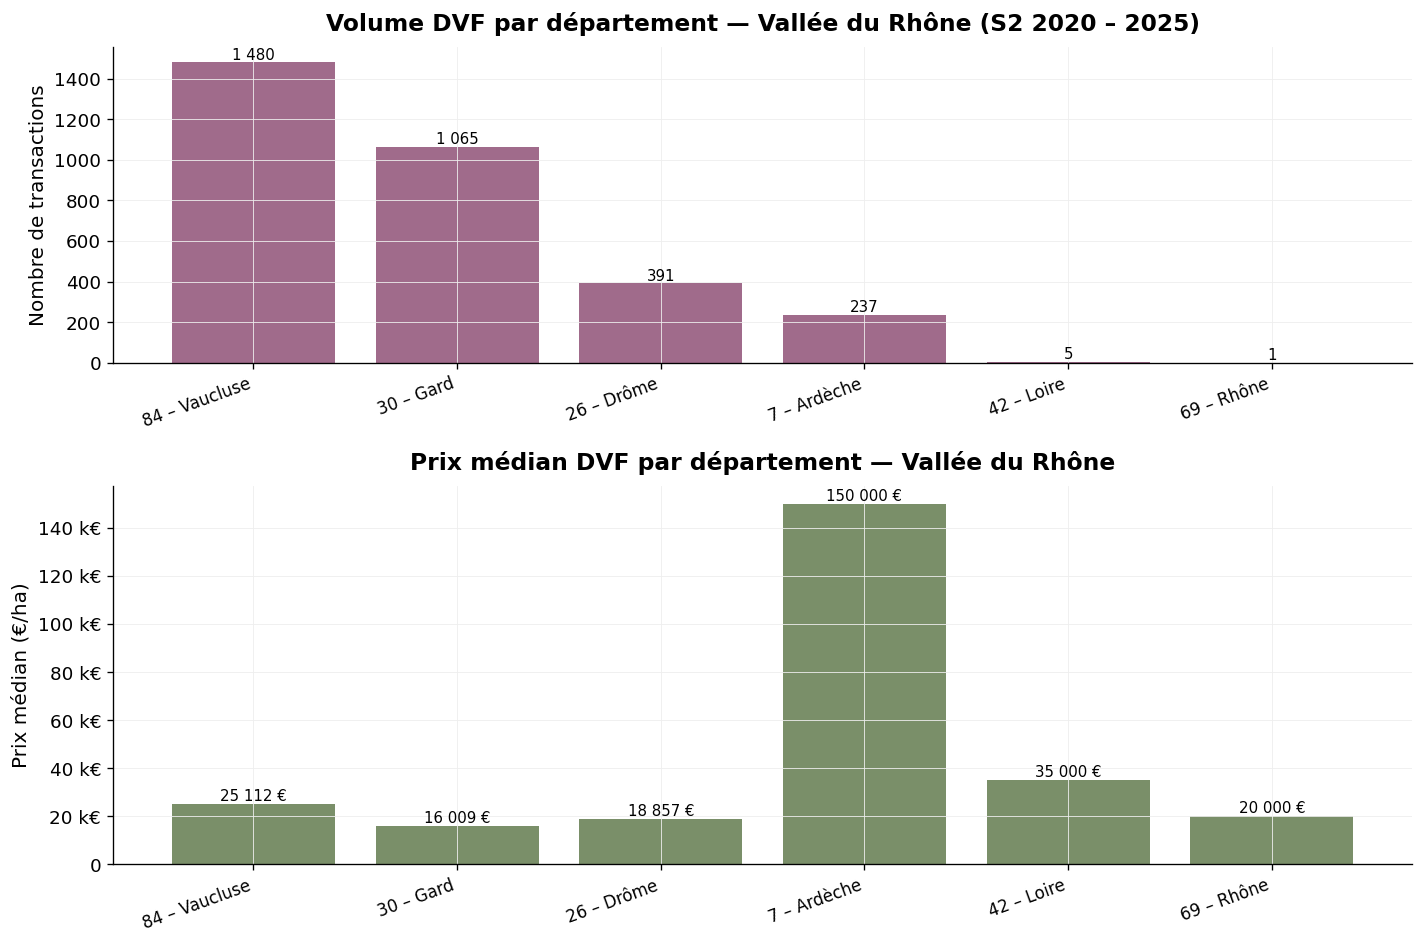
Volume and median price by department — Rhône Valley, H2 2020 – 2025 — Source: DVF, ma-propriete.fr analysis
The southern heart of the vineyard, Vaucluse concentrates 1,480 transactions over the period, with a median price of €25,112/ha and an average of €83,412/ha. The average/median gap (3.3×) reflects the presence of exceptional transactions in Châteauneuf-du-Pape, Gigondas, Vacqueyras and Cairanne. The maximum observed (€590,784/ha) corresponds to a prestigious plot of Châteauneuf-du-Pape. The trajectory of the median is stable between €23,000 and €29,000/ha over the period.
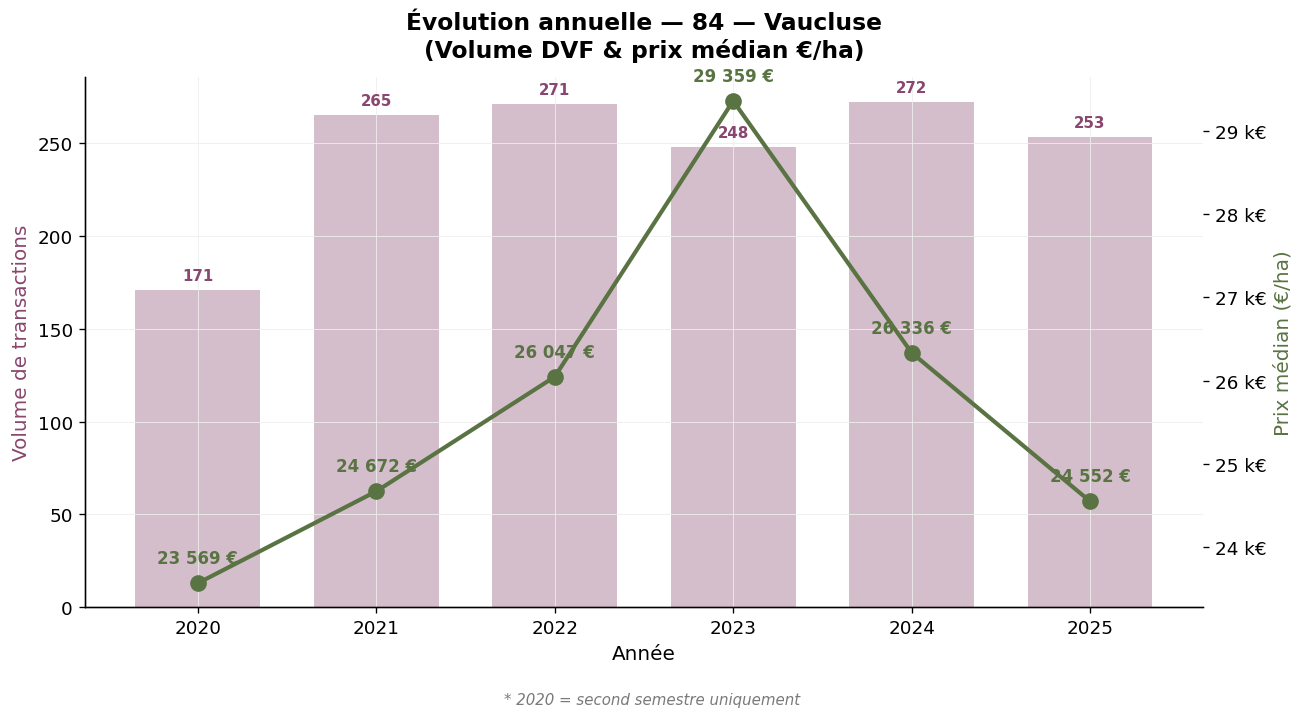
Vaucluse (84) — Annual evolution — Source: DVF, ma-propriete.fr analysis
The AOC Rhône part of Gard counts 1,065 transactions (excluding AOC Languedoc transactions covered in our Languedoc-Roussillon article). The median price stands at €16,009/ha, significantly lower than Vaucluse, which reflects a combination of less prestigious AOC Côtes du Rhône and Côtes du Rhône Villages. The average area (19,472 m²) is high, a sign of a more extensive vineyard.
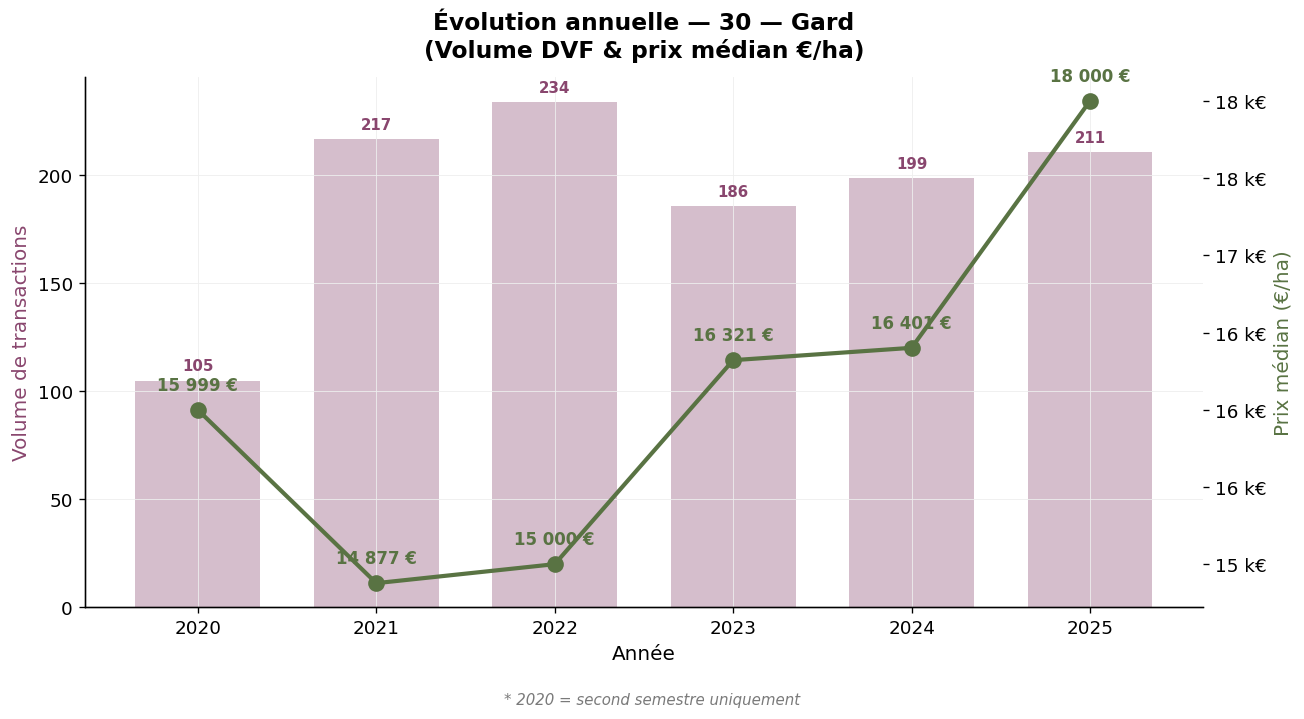
Gard (30) — AOC Rhône part — Annual evolution — Source: DVF, ma-propriete.fr analysis
Drôme has 391 transactions, median price €18,857/ha. This department concentrates various AOCs: Crozes-Hermitage and Saint-Joseph on the northern side, Grignan-les-Adhémar and Vinsobres on the southern side. The median fell slightly in 2025 (€16,308/ha) after several stable years around €19,000-20,000/ha.
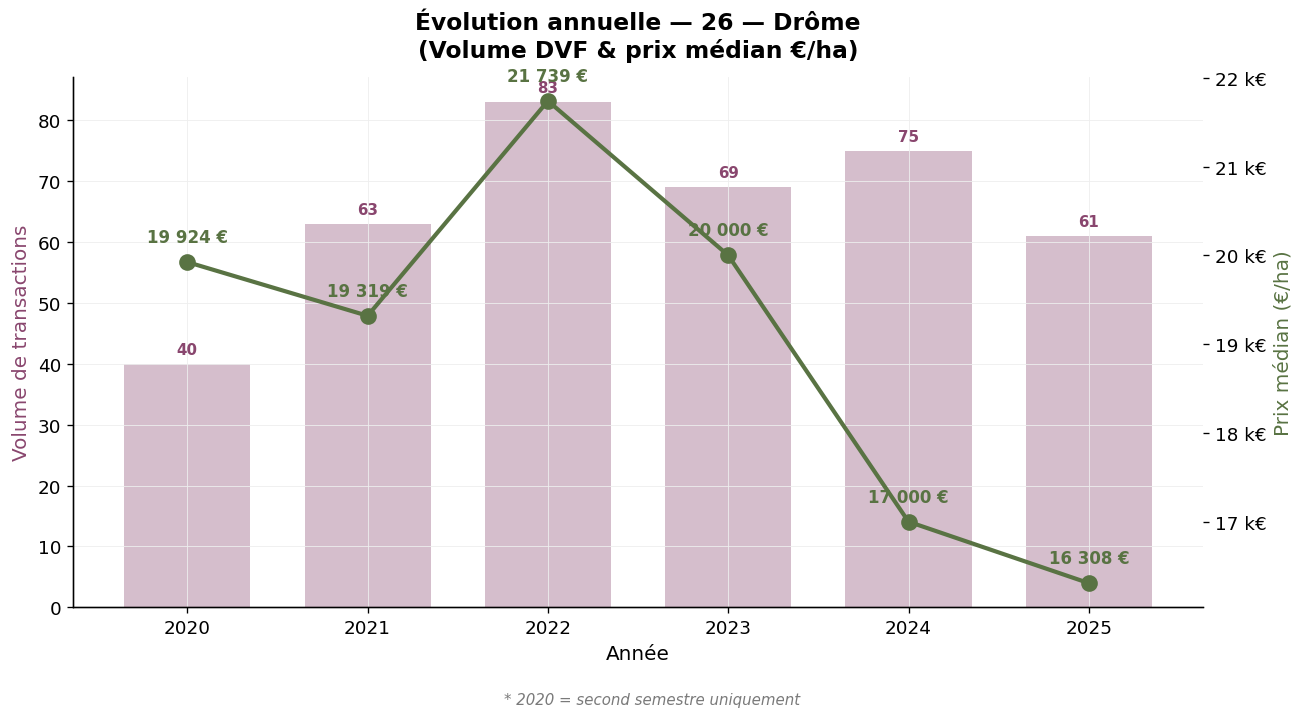
Drôme (26) — Annual evolution — Source: DVF, ma-propriete.fr analysis
With 237 transactions over the period, Ardèche is the department where the average/median gap is the most pronounced: average price €216,667/ha for a median of €150,000/ha. This high level reflects the concentration of transactions on the northern Rhône crus (Cornas, Saint-Péray, part of Saint-Joseph), with very high land value. The maximum observed (€589,623/ha) corresponds to iconic plots.
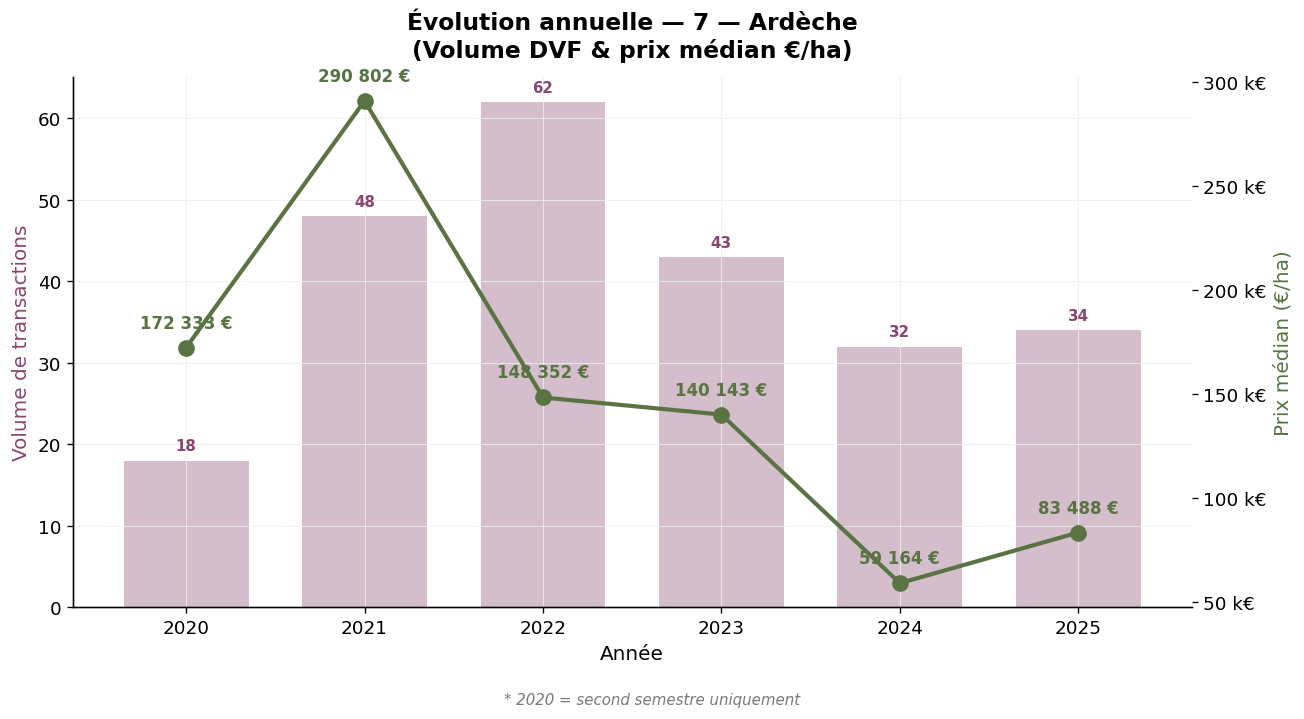
Ardèche (7) — Annual evolution — Source: DVF, ma-propriete.fr analysis
The other departments of the Rhône region complete the panorama with more modest volumes. Loire (42) records 5 transactions in the northern AOC part (Côte-Rôtie and Condrieu in part) for a median price of €35,000/ha. Rhône (69) has only one transaction in the "Rhône Valley vineyard" sense (the department's transactions are massively attached to Beaujolais). As these volumes are insufficient to produce reliable statistics, we mention them for information purposes.
The seasonality of Rhône transactions is relatively balanced: Q1 22.8%, Q2 27.1%, Q3 26.2%, Q4 23.9%. The second and third quarters concentrate slightly more activity, which reflects the transaction window suitable for finalisations outside the harvest period.
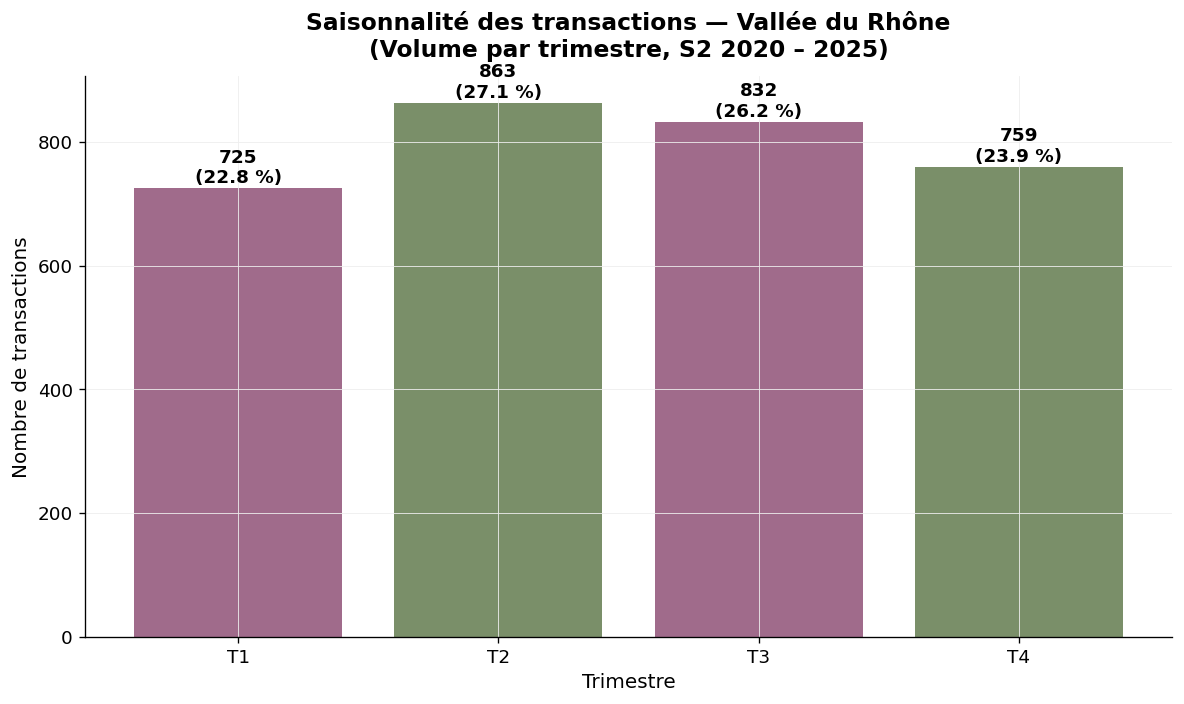
Seasonality — Rhône Valley, volume by quarter — Source: DVF, ma-propriete.fr analysis
The DVF database lists all property transactions for valuable consideration recorded by the DGFiP. To isolate vineyard transactions from this database, our observatory applies several filters: selection of plots registered in the "vineyards" land use category, cross-referencing with the INAO directory commune by commune (notably to distinguish, in Gard, AOC Rhône from AOC Languedoc), elimination of atypical transactions. The median price, which represents the level at which half of the market is concluded, is our reference indicator.
The year 2020 covers only the second half. Mixed properties (vineyards + operating buildings) are excluded when the value of the buildings represents a significant share. Departments with low transaction volumes (Loire 42, Rhône 69) are flagged by their small numbers; we recommend cautious interpretation.
SAFER statistics are based on a survey of notaries and filtering of transactions of more than half a hectare in one block. They provide an annual average price with a remarkable historical depth (since 1991), aggregated for the entire Rhône Valley-Provence region. Our DVF approach complements this view by isolating the Rhône Valley alone and providing a median price.
| Vineyard | 2025 median price (€/ha) | Detailed article |
|---|---|---|
| Champagne | 1,000,000 | Champagne |
| Burgundy | 125,000 | Burgundy-Franche-Comté |
| Savoie | 57,216 | Savoie |
| Provence | 39,864 | Provence |
| Jura | 39,361 | Jura |
| Beaujolais | 39,312 | Beaujolais |
| Cognac | 28,636 | Cognac |
| Rhône Valley | 20,357 | Current article |
| Loire Valley | 17,000 | Loire Valley |
| Bordeaux | 15,434 | Bordeaux |
| Roussillon | 13,918 | Languedoc-Roussillon |
| Languedoc | 13,531 | Languedoc-Roussillon |
| South-West | 9,205 | South-West |
The Rhône Valley offers, over the 2020-2025 period, a dual land market: a vast southern base stable around €20,000/ha median, and a northern peak above €150,000/ha. Vaucluse concentrates activity (1,480 transactions), Gard offers the most accessible entry points, Ardèche and Drôme combine both dynamics. For buyers, the opportunity depends on the project: mass production in regional Côtes du Rhône, quality repositioning in Côtes du Rhône Villages, or high-value patrimonial project in northern crus or Châteauneuf-du-Pape. To go further, you can consult our wine-growing listings category, our other articles on vineyard prices or download our white paper dedicated to creating a wine estate.