Updated on May 7, 2026: Find the most recent data on our Agricultural Land Price Observatory (DVF data 2020-2025), which presents average prices, median prices and transaction ranges for your region and each department.
Summary of the main DVF statistics for the year 2025, now fully available. The figures below relate exclusively to agricultural land excluding vineyards (arable crops, pastures, tillable land, specialised crops).
| 2025 Key Figures — Provence-Alpes-Côte d'Azur | |
|---|---|
| Average price | 14,884 €/ha |
| Median price | 13,518 €/ha |
| First decile (P10) | 5,947 €/ha |
| Ninth decile (P90) | 23,101 €/ha |
| Number of sales | 59 |
| Average area | 7.49 ha |
| Change vs 2024 | +14.4% |
Provence-Alpes-Côte d'Azur is a strongly Mediterranean region: olive groves, orchards, market gardening and lavender cultivation dominate, complemented by extensive livestock farming in the Southern Alps. The regional utilised agricultural area (UAA) does not exceed 700,000 hectares, making it one of the smallest in France. The main regional agricultural activities — orcharding (cherry, apricot, apple), market gardening and greenhouse crops, olive groves, aromatic plants (lavender, lavandin), transhumant sheep farming — structure a land market whose levels and dynamics differ greatly from one department to another.
This article presents agricultural land prices in Provence-Alpes-Côte d'Azur based on DVF data (Demandes de Valeurs Foncières) processed by ma-propriete.fr, supplemented by Ministry of Agriculture publications from the SAFER. The year 2025, now fully available, is the primary focus; 2024 serves as a comparative reference. AOC vineyards (Côtes-de-Provence, Bandol, Cassis, Châteauneuf-du-Pape) are expressly excluded from the scope of this article.
In 2025, the average price of agricultural land in Provence-Alpes-Côte d'Azur stands at 14,884 €/ha, a change of +14.4% compared to 2024. The median price, a less sensitive indicator to extreme transactions, reached 13,518 €/ha. Over the full year, 59 transactions were recorded in the region with an average area per sale of 7.49 ha.
The gap between the first decile (5,947 €/ha) and the ninth decile (23,101 €/ha) — a P90/P10 ratio of 3.9 — illustrates the dispersion of prices within the region. This dispersion reflects the heterogeneity of terroirs, the diversity of production types and the variability of land pressure across different areas.
Over the 2021-2025 period (the first years fully covered by DVF), the regional average price has risen (+9.0%).
| Year | Number of sales | Average price | Median price | P10 | P90 | Average area |
|---|---|---|---|---|---|---|
| 2020 | 38 | 15,275 €/ha | 14,987 €/ha | 6,786 €/ha | 23,288 €/ha | 7.52 ha |
| 2021 | 74 | 13,660 €/ha | 13,640 €/ha | 4,771 €/ha | 20,262 €/ha | 9.01 ha |
| 2022 | 69 | 13,319 €/ha | 12,988 €/ha | 6,270 €/ha | 21,422 €/ha | 7.69 ha |
| 2023 | 70 | 12,123 €/ha | 11,118 €/ha | 4,794 €/ha | 20,339 €/ha | 6.95 ha |
| 2024 | 77 | 13,007 €/ha | 13,340 €/ha | 5,518 €/ha | 20,400 €/ha | 8.50 ha |
| 2025 | 59 | 14,884 €/ha | 13,518 €/ha | 5,947 €/ha | 23,101 €/ha | 7.49 ha |
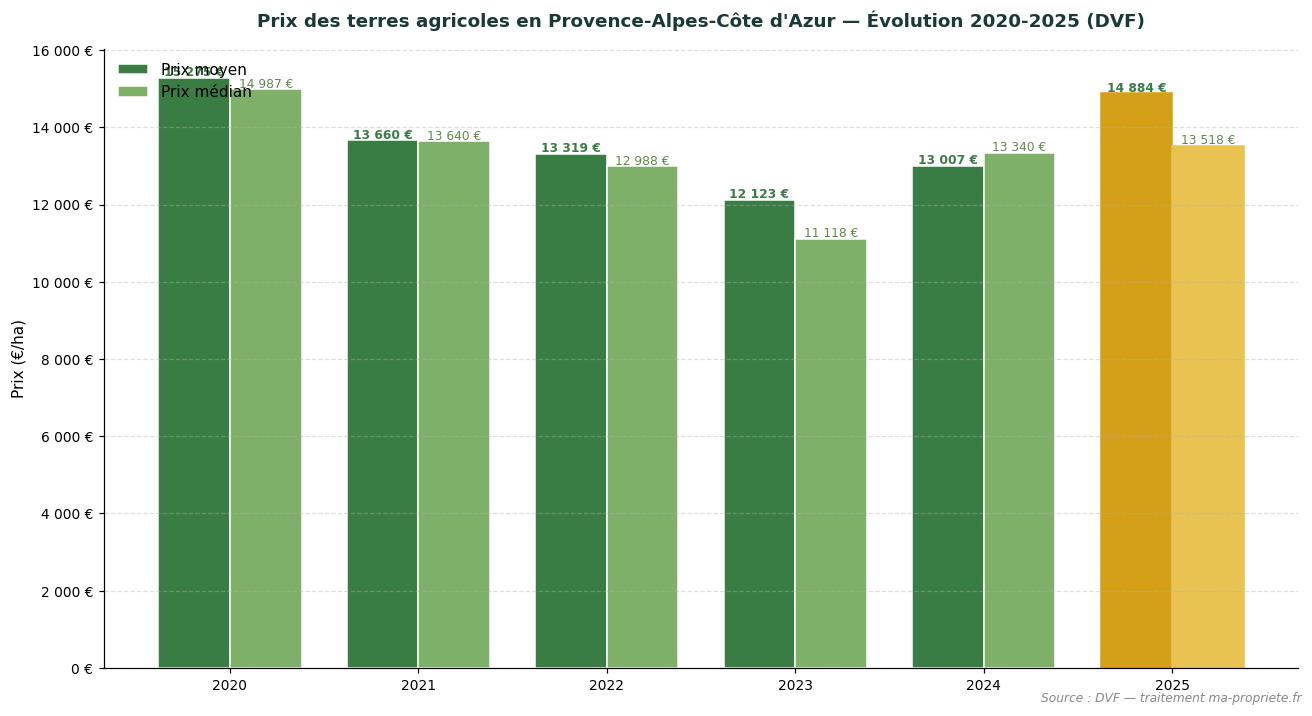
Trend in average and median agricultural land prices in Provence-Alpes-Côte d'Azur (2020-2025). Source: DVF, processed by ma-propriete.fr. The year 2025 is highlighted in gold.
The SAFERs publish an annual summary of agricultural land prices, distinguishing between sales of freehold land (plots not occupied by a tenant farmer) and sales of tenanted land (plots already under a rural lease). In Provence-Alpes-Côte d'Azur, the most recent year available is 2024: the average price of freehold land stands at 11,930 €/ha, compared to not available (insufficient volume) for tenanted land.
| Year | Freehold land (SAFER) | Tenanted land (SAFER) |
|---|---|---|
| 2015 | 10,900 €/ha | — |
| 2018 | 11,070 €/ha | — |
| 2020 | 12,230 €/ha | — |
| 2022 | 12,020 €/ha | — |
| 2023 | 10,500 €/ha | — |
| 2024 | 11,930 €/ha | — |
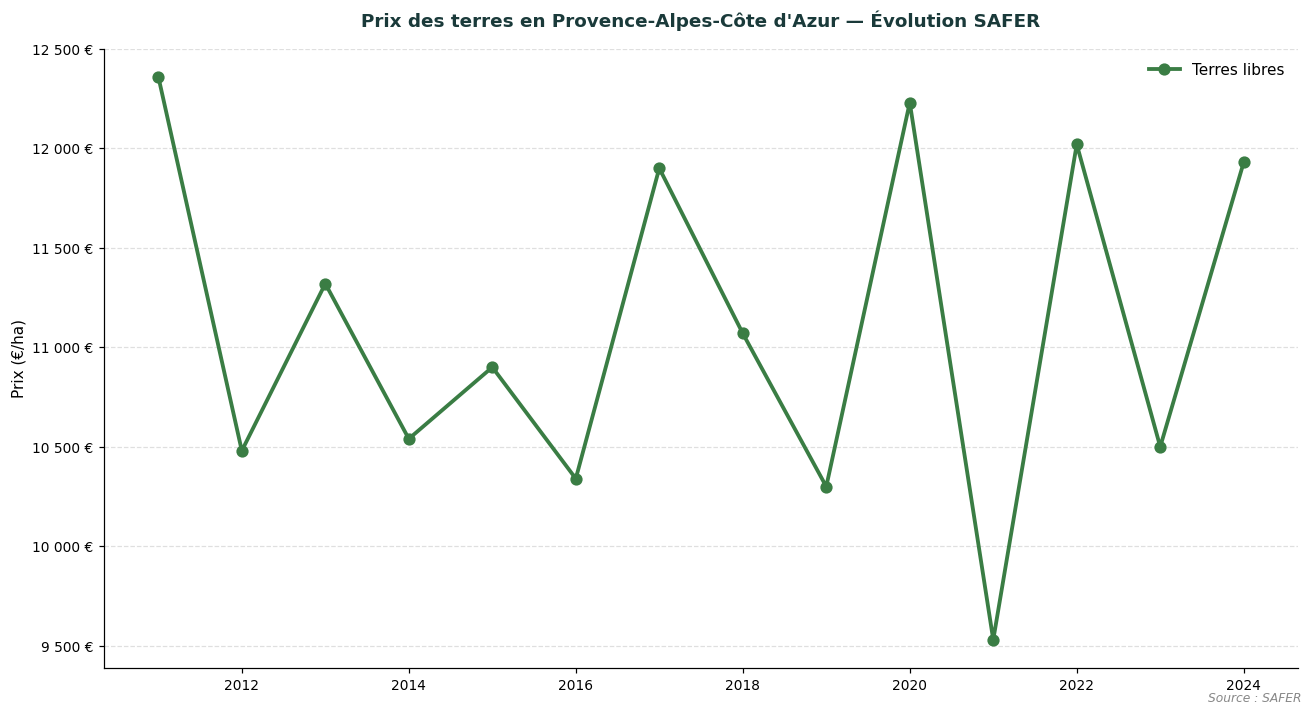
Comparative trend in freehold and tenanted land prices in Provence-Alpes-Côte d'Azur. Source: SAFER — Le Prix des terres.
SAFER figures are not directly comparable to the DVF figures presented above: SAFER only covers part of the market (transactions subject to pre-emption rights or intermediation), whereas DVF captures all recorded transfers. The two sources are complementary and allow the land market to be assessed from two distinct angles.
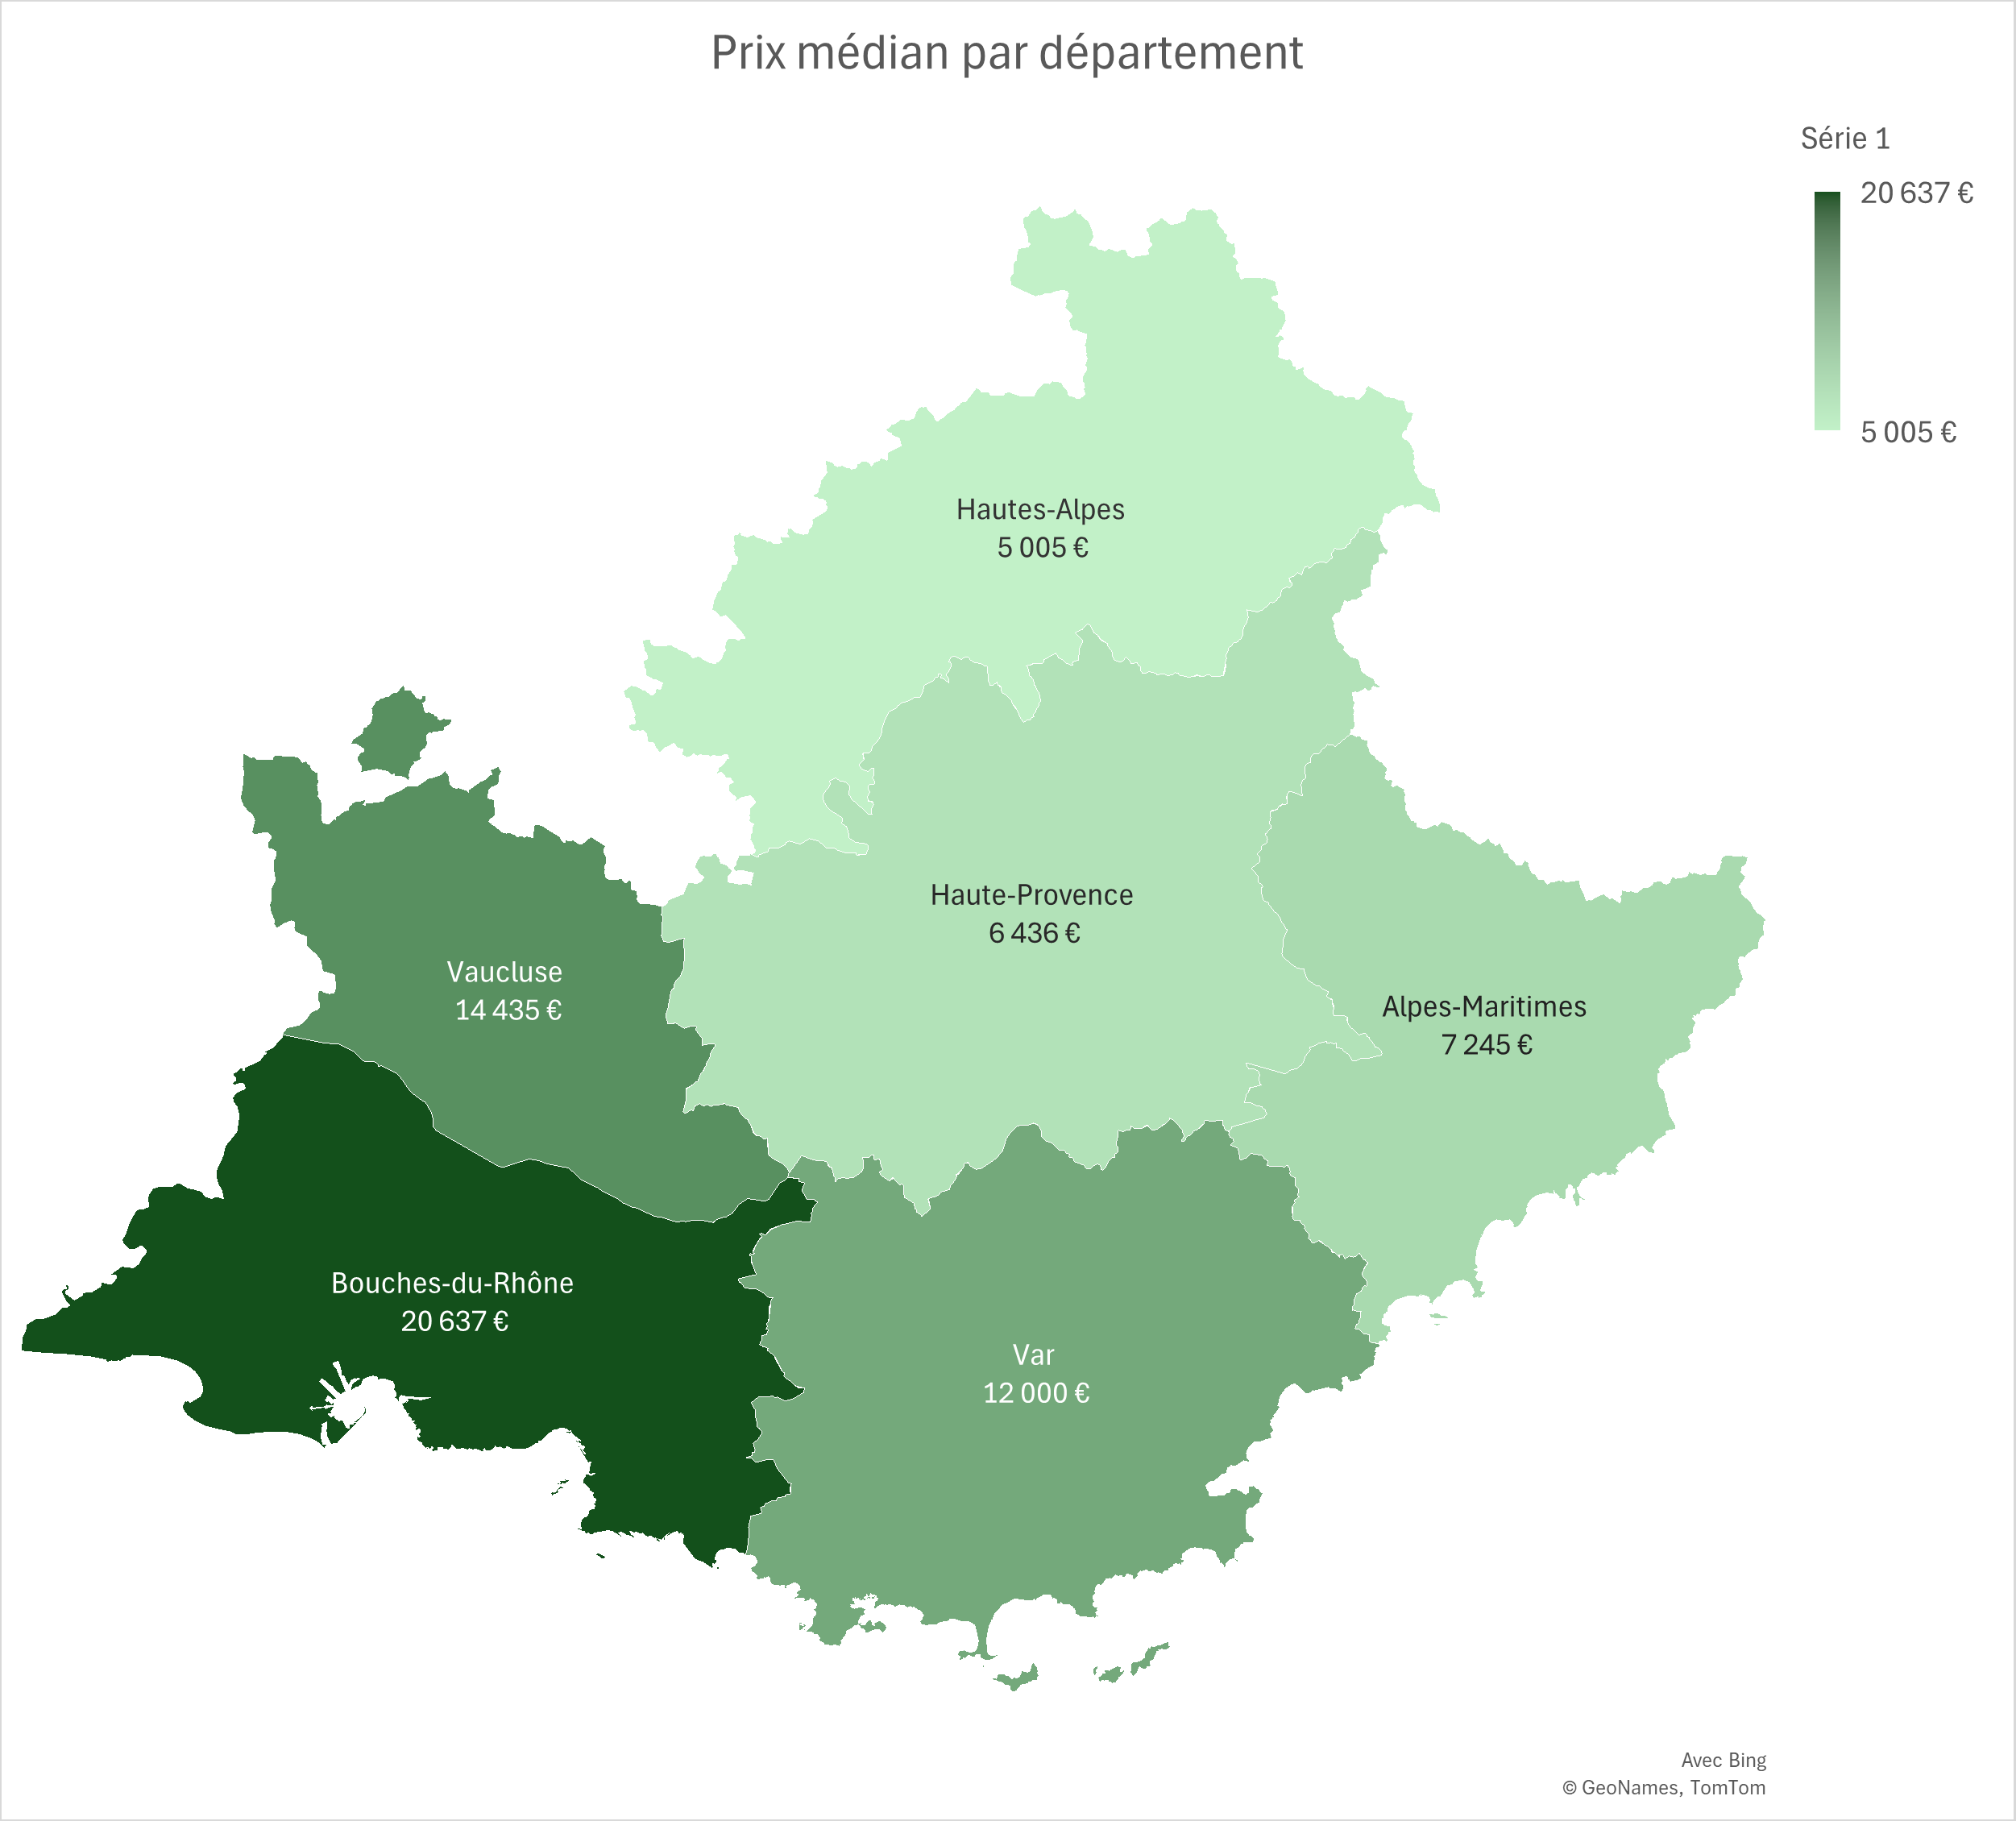
Alpes-de-Haute-Provence combines extensive livestock farming, lavender cultivation and orcharding, with a limited-volume land market. In 2025, the average price of agricultural land in the department stands at 7,310 €/ha (+11.1% compared to 2024). The median price reached 6,436 €/ha, based on 9 recorded transactions (average area 6.58 ha). The low number of transactions (fewer than 30 sales) calls for caution when interpreting annual averages.
| Year | No. of sales | Average price | Median price | Avg. area |
|---|---|---|---|---|
| 2020 | — | — | — | — |
| 2021 | 18 | 6,333 €/ha | 5,633 €/ha | 6.80 ha |
| 2022 | 11 | 6,651 €/ha | 6,780 €/ha | 13.83 ha |
| 2023 | 15 | 5,873 €/ha | 5,159 €/ha | 7.12 ha |
| 2024 | 12 | 6,579 €/ha | 7,121 €/ha | 9.12 ha |
| 2025 | 9 | 7,310 €/ha | 6,436 €/ha | 6.58 ha |
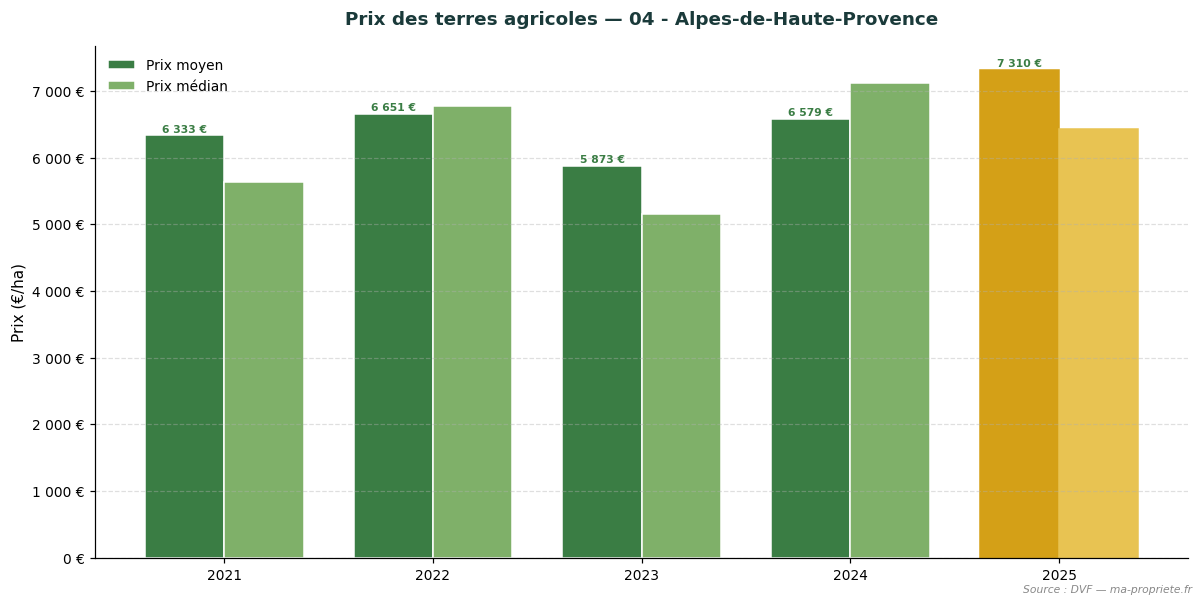
Trend in agricultural land prices — 04 - Alpes-de-Haute-Provence. Source: DVF, processed by ma-propriete.fr. The year 2025 is highlighted in gold.
Hautes-Alpes, dominated by mountain livestock farming and orcharding, has a low-volume land market. In 2025, the average price of agricultural land in the department stands at 5,892 €/ha (+11.7% compared to 2024). The median price reached 5,005 €/ha, based on 3 recorded transactions (average area 7.79 ha). The low number of transactions (fewer than 30 sales) calls for caution when interpreting annual averages.
| Year | No. of sales | Average price | Median price | Avg. area |
|---|---|---|---|---|
| 2020 | 3 | 3,665 €/ha | 3,619 €/ha | 6.95 ha |
| 2021 | 4 | 5,895 €/ha | 5,742 €/ha | 5.82 ha |
| 2022 | 3 | 6,236 €/ha | 6,127 €/ha | 5.02 ha |
| 2023 | 3 | 4,947 €/ha | 5,195 €/ha | 5.80 ha |
| 2024 | 9 | 5,273 €/ha | 5,540 €/ha | 7.79 ha |
| 2025 | 3 | 5,892 €/ha | 5,005 €/ha | 7.79 ha |
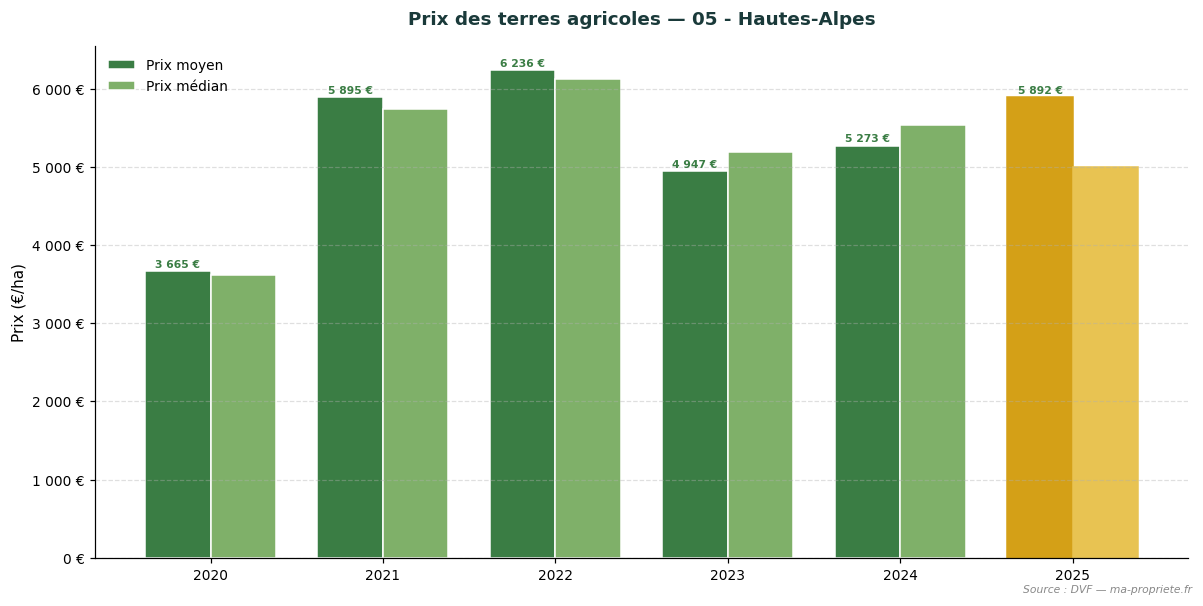
Trend in agricultural land prices — 05 - Hautes-Alpes. Source: DVF, processed by ma-propriete.fr. The year 2025 is highlighted in gold.
Alpes-Maritimes (excluding urban areas) retains a residual agricultural market, strongly influenced by coastal land pressure. In 2025, the average price of agricultural land in the department stands at 7,245 €/ha (— compared to 2024). The median price reached 7,245 €/ha, based on 1 recorded transaction (average area 6.63 ha). The low number of transactions (fewer than 30 sales) calls for caution when interpreting annual averages.
| Year | No. of sales | Average price | Median price | Avg. area |
|---|---|---|---|---|
| 2020 | — | — | — | — |
| 2021 | — | — | — | — |
| 2022 | 1 | 10,068 €/ha | 10,068 €/ha | 3.97 ha |
| 2023 | 1 | 8,046 €/ha | 8,046 €/ha | 3.73 ha |
| 2024 | — | — | — | — |
| 2025 | 1 | 7,245 €/ha | 7,245 €/ha | 6.63 ha |
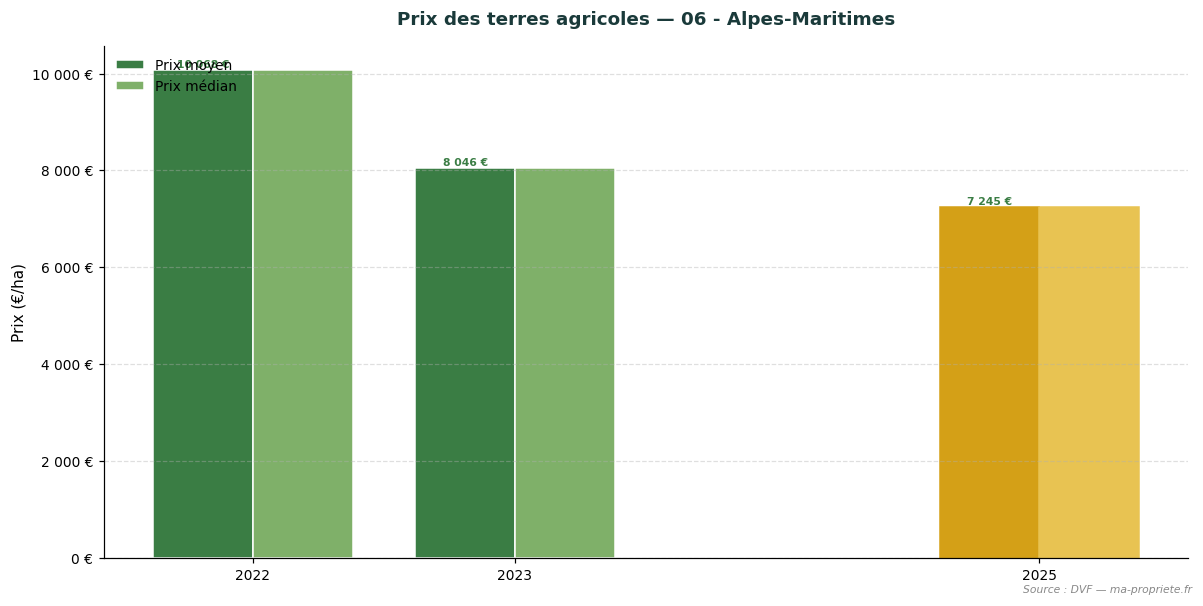
Trend in agricultural land prices — 06 - Alpes-Maritimes. Source: DVF, processed by ma-propriete.fr. The year 2025 is highlighted in gold.
Bouches-du-Rhône combines intensive market gardening, rice cultivation in the Camargue and orcharding, on one of the most expensive land markets in France. In 2025, the average price of agricultural land in the department stands at 19,365 €/ha (+20.2% compared to 2024). The median price reached 20,637 €/ha, based on 24 recorded transactions (average area 8.73 ha). The low number of transactions (fewer than 30 sales) calls for caution when interpreting annual averages.
| Year | No. of sales | Average price | Median price | Avg. area |
|---|---|---|---|---|
| 2020 | 23 | 17,731 €/ha | 17,031 €/ha | 8.66 ha |
| 2021 | 33 | 17,226 €/ha | 17,384 €/ha | 11.69 ha |
| 2022 | 20 | 15,711 €/ha | 15,000 €/ha | 7.84 ha |
| 2023 | 27 | 15,673 €/ha | 15,315 €/ha | 8.29 ha |
| 2024 | 37 | 16,112 €/ha | 15,000 €/ha | 10.05 ha |
| 2025 | 24 | 19,365 €/ha | 20,637 €/ha | 8.73 ha |
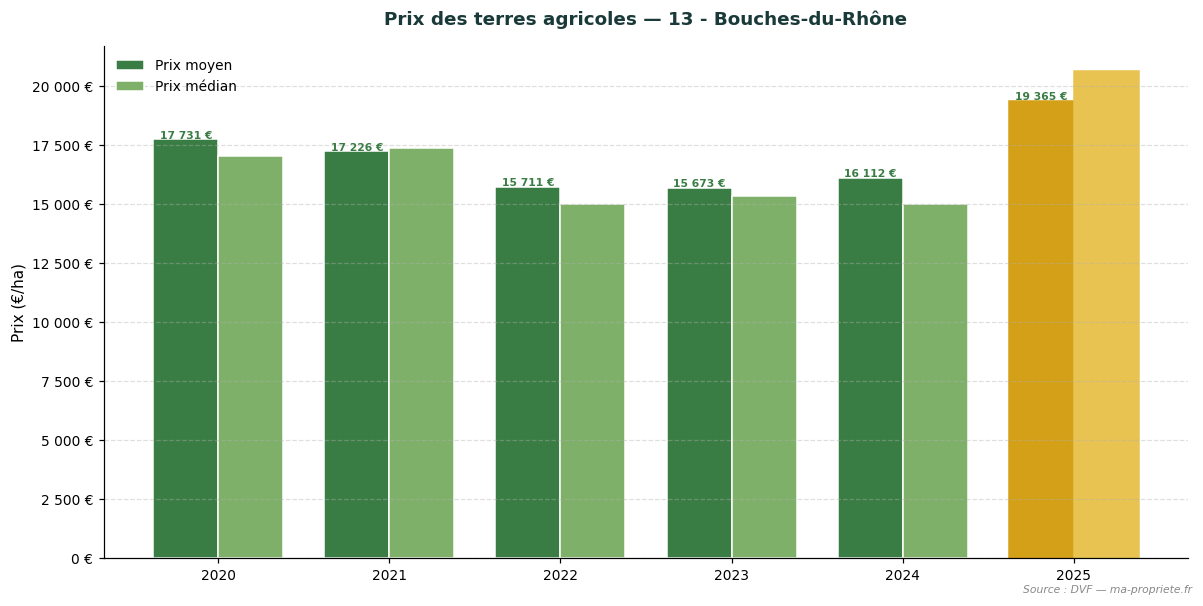
Trend in agricultural land prices — 13 - Bouches-du-Rhône. Source: DVF, processed by ma-propriete.fr. The year 2025 is highlighted in gold.
Var (excluding viticulture) incorporates orcharding, olive growing and Mediterranean produce. In 2025, the average price of agricultural land in the department stands at 12,926 €/ha (-46.1% compared to 2024). The median price reached 12,000 €/ha, based on 3 recorded transactions (average area 4.63 ha). The low number of transactions (fewer than 30 sales) calls for caution when interpreting annual averages.
| Year | No. of sales | Average price | Median price | Avg. area |
|---|---|---|---|---|
| 2020 | 4 | 16,834 €/ha | 19,227 €/ha | 4.92 ha |
| 2021 | 1 | 29,120 €/ha | 29,120 €/ha | 3.76 ha |
| 2022 | 8 | 20,880 €/ha | 22,012 €/ha | 4.36 ha |
| 2023 | 3 | 24,289 €/ha | 22,393 €/ha | 3.48 ha |
| 2024 | 1 | 24,000 €/ha | 24,000 €/ha | 6.48 ha |
| 2025 | 3 | 12,926 €/ha | 12,000 €/ha | 4.63 ha |
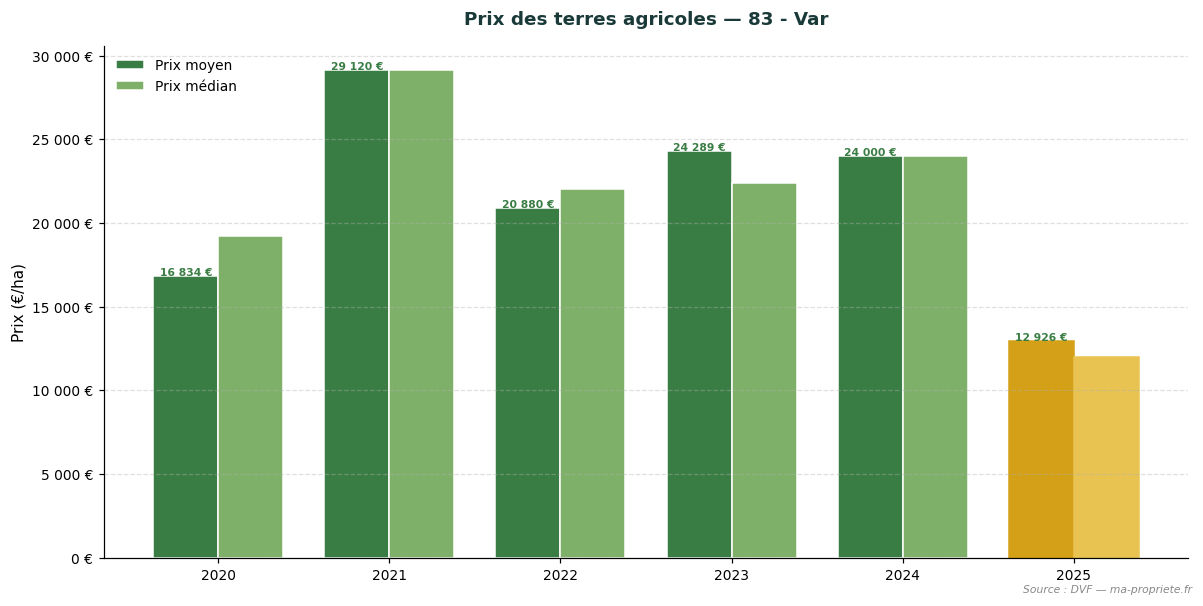
Trend in agricultural land prices — 83 - Var. Source: DVF, processed by ma-propriete.fr. The year 2025 is highlighted in gold.
Vaucluse, a land of orcharding (cherry, table grapes), market gardening and aromatic plants, presents a tight market. In 2025, the average price of agricultural land in the department stands at 14,943 €/ha (+5.5% compared to 2024). The median price reached 14,435 €/ha, based on 19 recorded transactions (average area 6.82 ha). The low number of transactions (fewer than 30 sales) calls for caution when interpreting annual averages.
| Year | No. of sales | Average price | Median price | Avg. area |
|---|---|---|---|---|
| 2020 | 8 | 11,787 €/ha | 11,989 €/ha | 5.77 ha |
| 2021 | 18 | 15,317 €/ha | 15,451 €/ha | 7.33 ha |
| 2022 | 26 | 12,915 €/ha | 11,899 €/ha | 6.45 ha |
| 2023 | 21 | 11,503 €/ha | 10,869 €/ha | 5.93 ha |
| 2024 | 18 | 14,167 €/ha | 12,687 €/ha | 5.37 ha |
| 2025 | 19 | 14,943 €/ha | 14,435 €/ha | 6.82 ha |
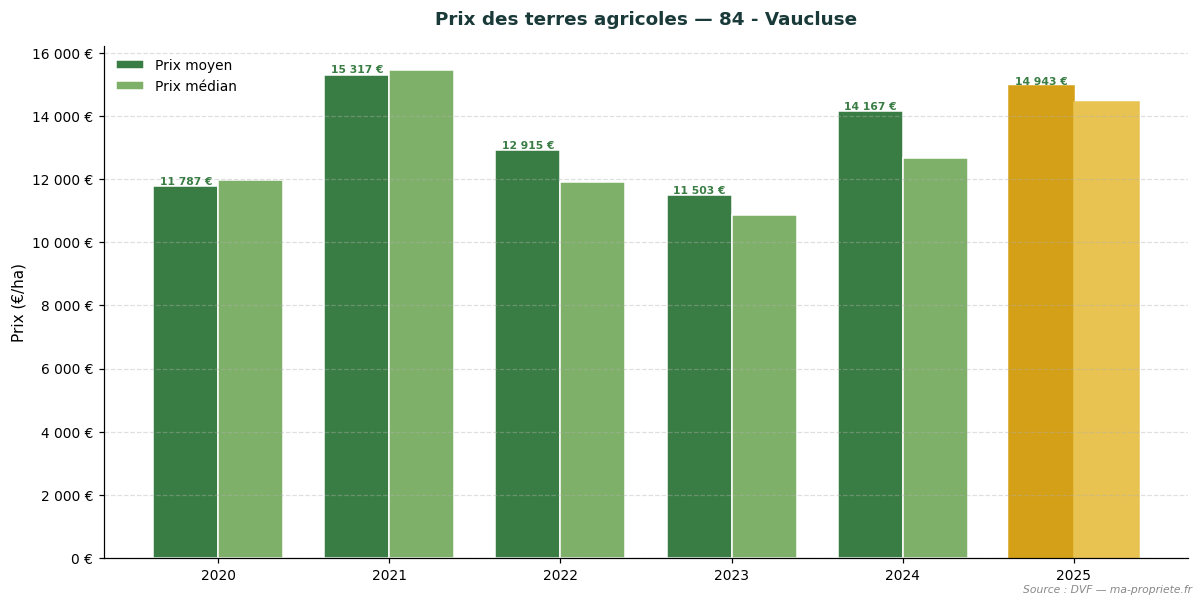
Trend in agricultural land prices — 84 - Vaucluse. Source: DVF, processed by ma-propriete.fr. The year 2025 is highlighted in gold.
The statistics presented in this article are based on the DVF (Demandes de Valeurs Foncières) database, published by the French Directorate General of Public Finances. This database records all real estate property transfers registered in mainland France and the overseas departments. We applied rigorous filtering to retain only transactions corresponding to strictly agricultural parcels (arable land, pastures, specialised crops excluding vineyards), systematically excluding built properties, vineyards and AOC wine estates, as well as mixed sales combining plots and buildings.
For each retained transaction, we calculate the price per hectare by dividing the declared land value by the area of the transferred property. Regional and departmental statistics then aggregate these unit values: average price, median price, first decile (P10) and ninth decile (P90), average area, and total number of annual sales.
The use of DVF data requires several methodological precautions.
The statistics published annually by the SAFERs (Sociétés d'aménagement foncier et d'établissement rural) and the Ministry of Agriculture differ from our DVF approach on several points. The SAFERs rely on transactions subject to their pre-emption rights or intermediation, which covers only part of the market. They also explicitly distinguish between sales of freehold land (not occupied by a tenant farmer) and sales of tenanted land (already under a rural lease), with a structural discount of approximately 18% for the latter.
The DVF approach, more comprehensive, incorporates all recorded transfers regardless of tenancy status. This explains why average DVF figures may differ from SAFER publications, particularly in regions where the share of tenanted sales is significant. We present both series in parallel to offer the most complete possible view of the agricultural land market.
The year 2025 confirms the stability of the agricultural land market in Provence-Alpes-Côte d'Azur as a whole, with a regional average price of 14,884 €/ha (+14.4% vs 2024). Behind this average, the region's 6 departments show differentiated dynamics reflecting the diversity of terroirs and production types. The PACA market is one of the most expensive in France outside AOC wine zones. Coastal land pressure, the scarcity of irrigable land and the multiplicity of uses (residential, tourist) are keeping prices sustainably high. The low number of transactions in certain departments (Alpes-Maritimes, Var excluding viticulture) requires statistical caution.
To regularly track trends in the agricultural land market, consult the agricultural land price observatory on ma-propriete.fr, as well as the agricultural section and the agricultural listings published on our portal.
To explore the French agricultural land market in greater depth, find our dedicated articles for each region.