Updated May 7, 2026
We have built an Agricultural Land Price Observatory in France using DVF data published by the tax administration. Discover farmland sale prices in the Bourgogne-Franche-Comté region from July 1, 2020 to December 31, 2025.
Summary of the main DVF statistics for 2025, now available in full. The figures below cover exclusively agricultural land excluding vineyards (arable crops, grasslands, tillable land, specialised crops).
| Key figures 2025 — Bourgogne-Franche-Comté | |
|---|---|
| Average price | €2,907/ha |
| Median price | €2,773/ha |
| First decile (P10) | €1,813/ha |
| Ninth decile (P90) | €4,185/ha |
| Number of sales | 1,303 |
| Average area | 10.36 ha |
| Change vs 2024 | +0.1% |
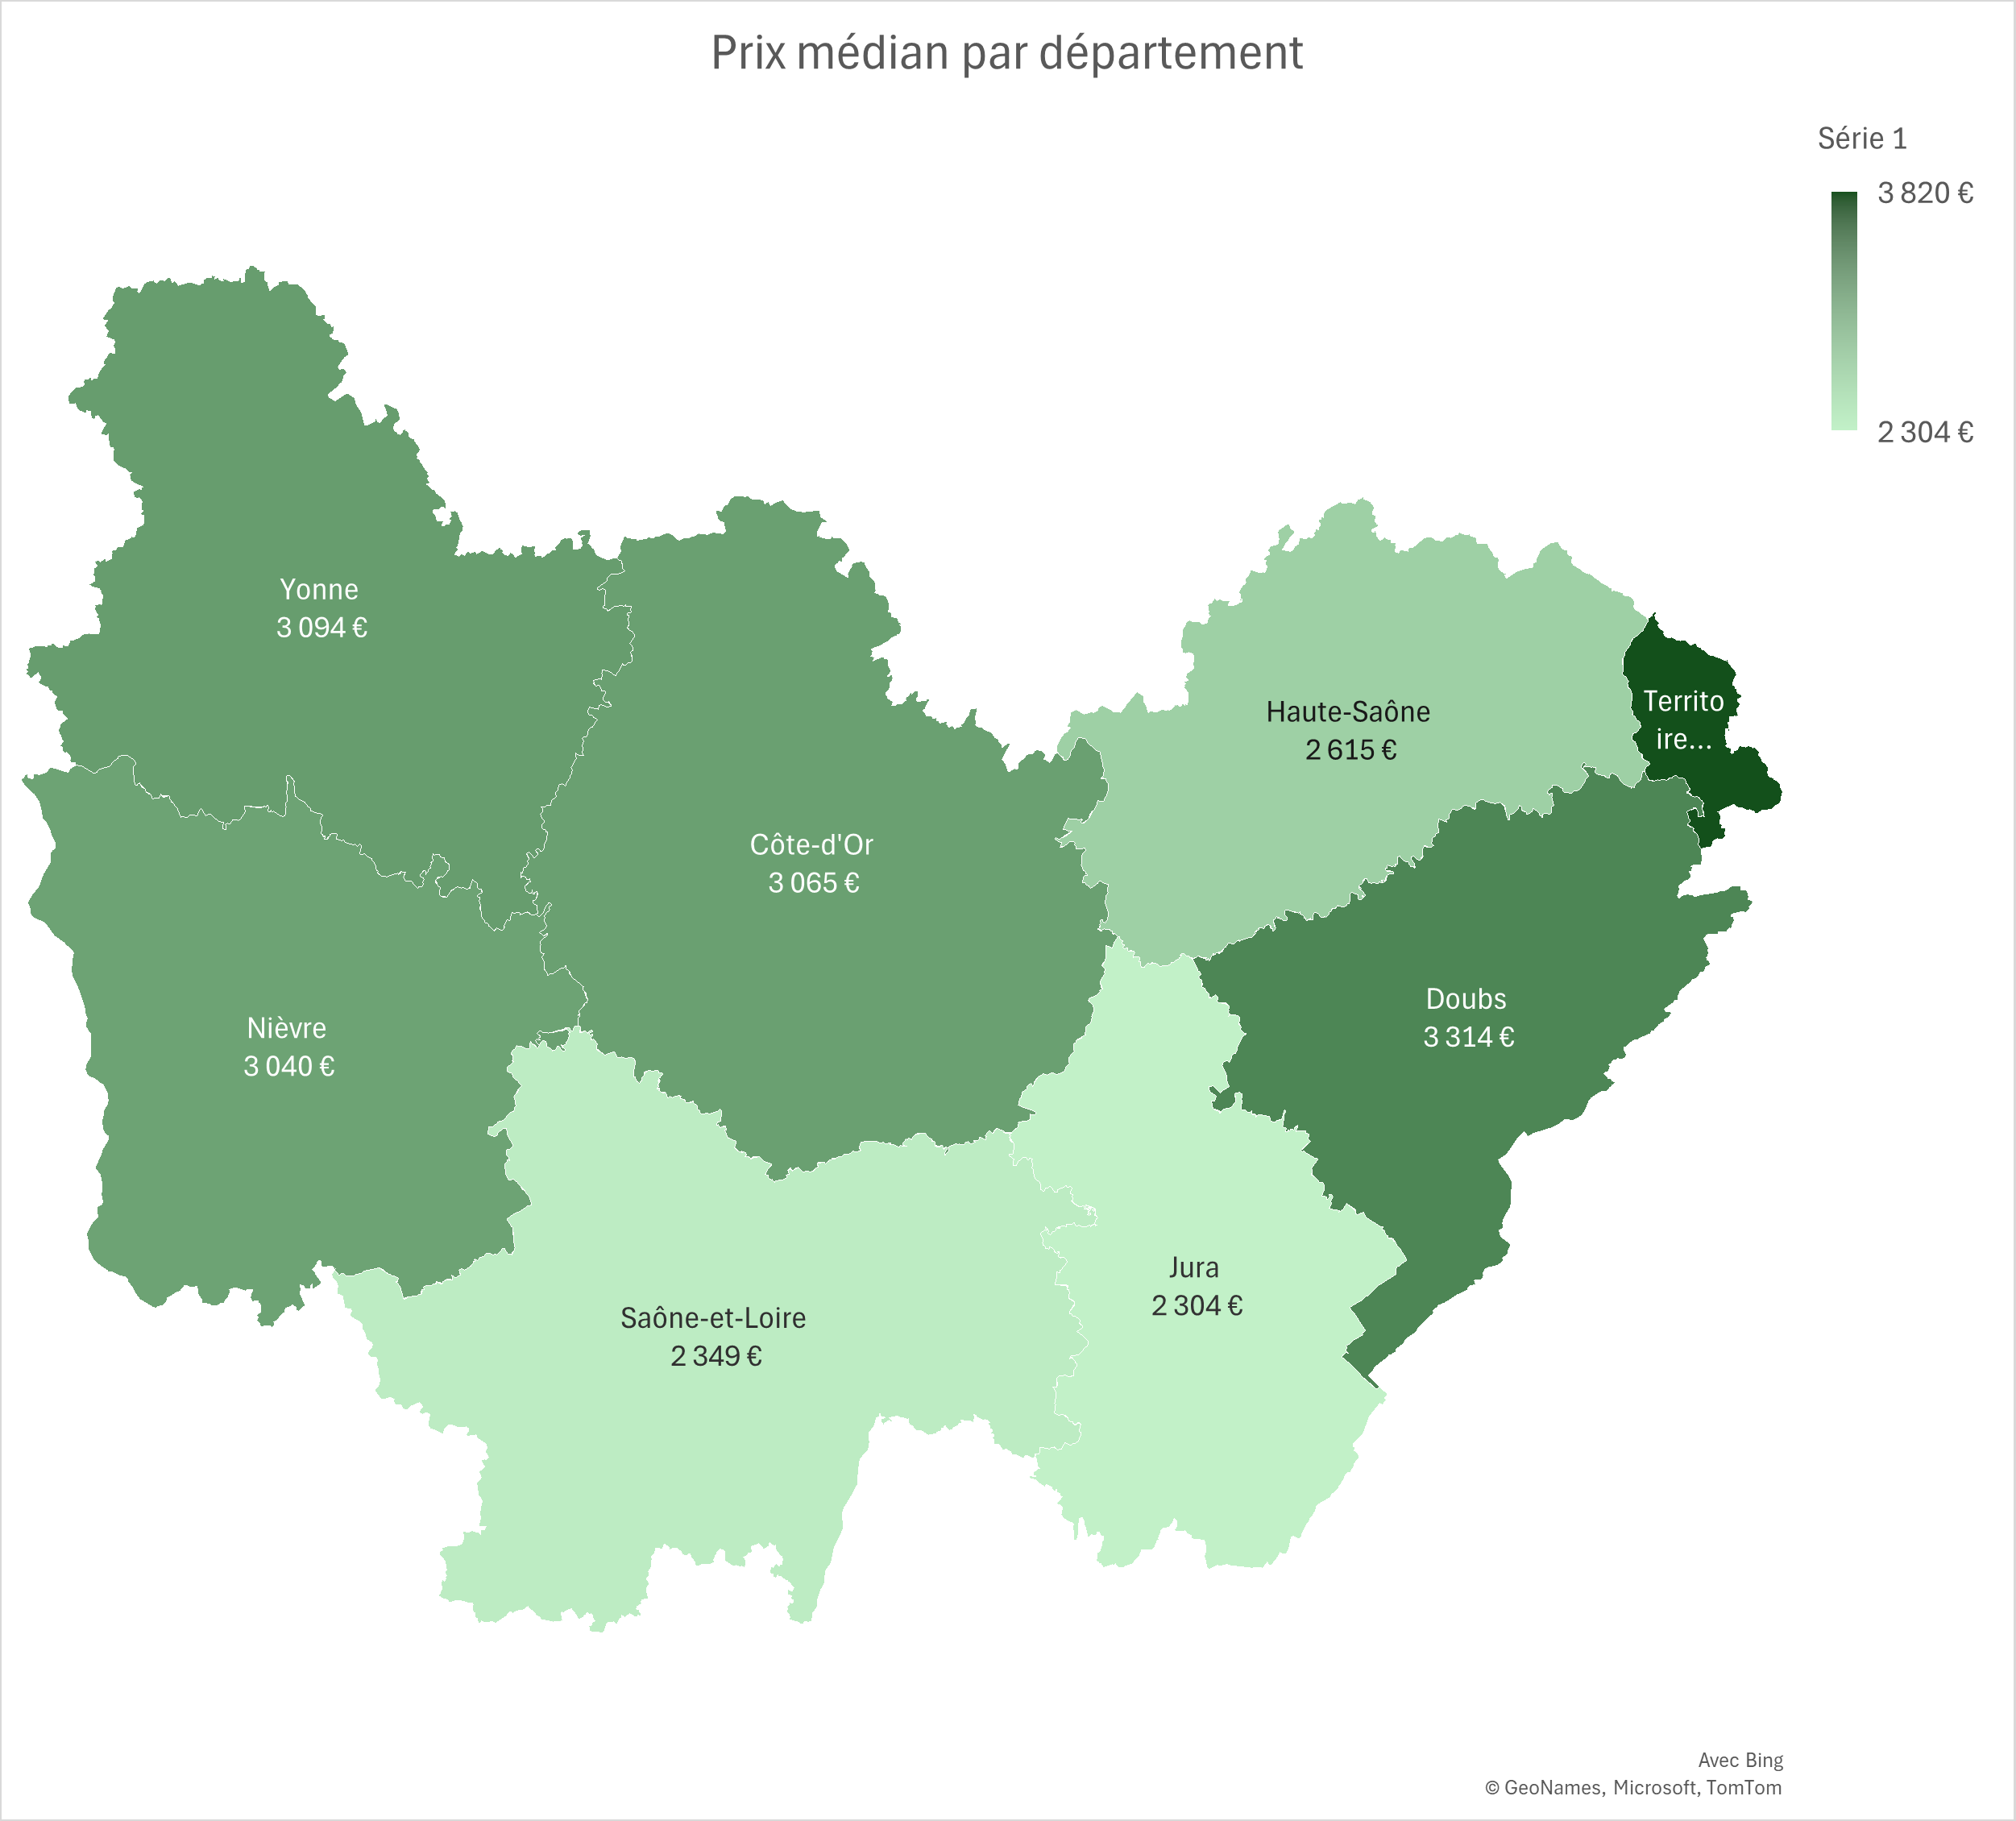 Bourgogne-Franche-Comté combines mixed crop-livestock farming areas (Saône-et-Loire, Nièvre), cereal-growing regions (Yonne, Côte-d'Or) and a Jura massif oriented towards PDO dairy farming. The regional UAA exceeds 1.9 million hectares, representing nearly 40% of the territory. The main regional agricultural orientations — mixed crop-beef cattle farming (Charolais, Limousin), PDO dairy farming (Comté/Morbier) in the Jura, cereal cropping in the Yonne and Côte-d'Or, permanent grasslands in Saône-et-Loire and Nièvre — structure a land market whose levels and dynamics differ significantly from one department to another.
This article presents agricultural land prices in Bourgogne-Franche-Comté based on DVF data (Demandes de Valeurs Foncières) processed by ma-propriete.fr, supplemented by Ministry of Agriculture publications derived from SAFER data. The year 2025, now available in full, is commented on as a priority; 2024 serves as the comparative reference. The Burgundy vineyard (Côte de Nuits, Côte de Beaune, Mâconnais, Chablisien, Côtes du Jura) constitutes a market in its own right, expressly excluded from the scope of this article.
In 2025, the average price of agricultural land in Bourgogne-Franche-Comté stands at €2,907/ha, representing a change of +0.1% compared to 2024. The median price, a less sensitive indicator to extreme transactions, reaches €2,773/ha. Over the full year, 1,303 transactions were recorded in the region with an average area per sale of 10.36 ha.
The gap between the first decile (€1,813/ha) and the ninth decile (€4,185/ha) — a P90/P10 ratio of 2.3 — illustrates the dispersion of prices within the region. This dispersion reflects the heterogeneity of terroirs, the diversity of productive orientations and the variability of land pressure by zone.
Over the 2021–2025 period (the first years fully covered by DVF), the regional average price is virtually stable (-0.4%).
| Year | Number of sales | Average price | Median price | P10 | P90 | Average area |
|---|---|---|---|---|---|---|
| 2020 | 576 | €2,893/ha | €2,594/ha | €1,739/ha | €4,485/ha | 10.97 ha |
| 2021 | 1,203 | €2,920/ha | €2,700/ha | €1,751/ha | €4,372/ha | 10.94 ha |
| 2022 | 1,339 | €2,872/ha | €2,750/ha | €1,752/ha | €4,205/ha | 10.38 ha |
| 2023 | 1,285 | €2,935/ha | €2,750/ha | €1,801/ha | €4,336/ha | 10.77 ha |
| 2024 | 1,291 | €2,904/ha | €2,763/ha | €1,800/ha | €4,290/ha | 10.67 ha |
| 2025 | 1,303 | €2,907/ha | €2,773/ha | €1,813/ha | €4,185/ha | 10.36 ha |
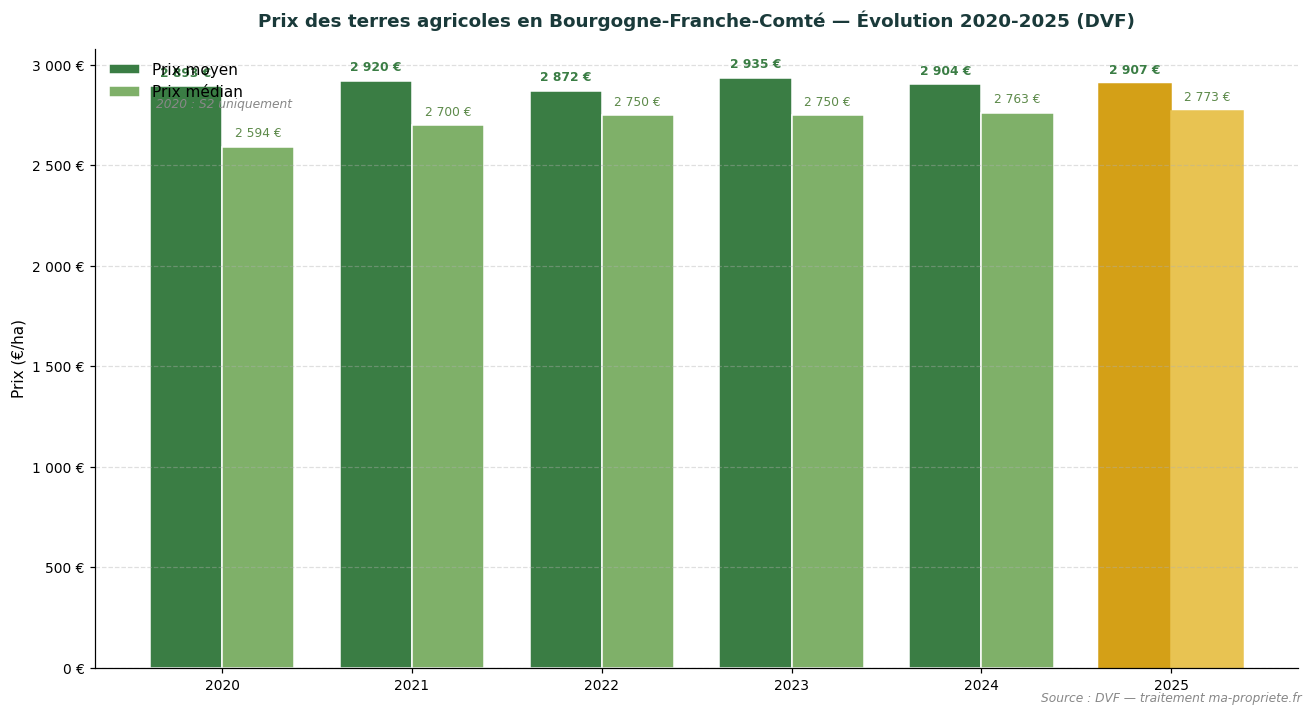
Trend in average and median agricultural land prices in Bourgogne-Franche-Comté (2020–2025). Source: DVF, processed by ma-propriete.fr. The year 2025 is highlighted in golden colour.
The SAFERs publish an annual summary of agricultural land prices, distinguishing sales of vacant land (plots not occupied by a tenant farmer) from sales of tenanted land (plots already under a rural lease). In Bourgogne-Franche-Comté, the latest available year is 2024: the average price for vacant land reaches €2,920/ha, compared to €2,670/ha for tenanted land. In 2024, the gap between vacant and tenanted land reaches 9% in Bourgogne-Franche-Comté, in line with the national average (~18%).
| Year | Vacant land (SAFER) | Tenanted land (SAFER) |
|---|---|---|
| 2015 | €2,980/ha | €2,600/ha |
| 2018 | €2,930/ha | €2,620/ha |
| 2020 | €2,970/ha | €2,650/ha |
| 2022 | €2,950/ha | €2,650/ha |
| 2023 | €2,930/ha | €2,760/ha |
| 2024 | €2,920/ha | €2,670/ha |
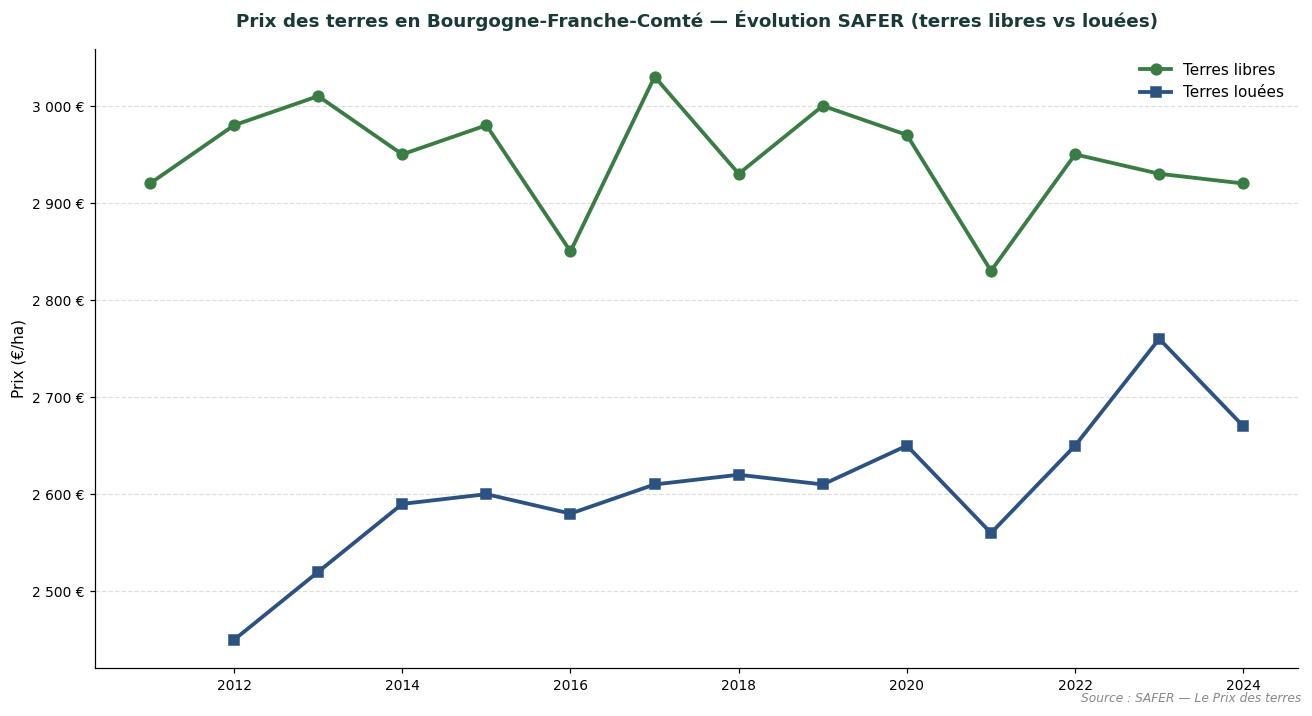
Comparative trend of vacant and tenanted land prices in Bourgogne-Franche-Comté. Source: SAFER — Le Prix des terres.
SAFER figures are not directly comparable to the DVF figures presented above: SAFER covers only a portion of the market (transactions subject to pre-emption rights or brokerage), whereas DVF captures all recorded transfers. The two sources are complementary and allow the land market to be assessed from two distinct angles.
Côte-d'Or combines cereal plateaus (Saône plain) and livestock farming areas in the Auxois and Châtillonnais. In 2025, the average price of agricultural land in the department stands at €3,183/ha (+2.1% compared to 2024). The median price reaches €3,065/ha, based on 170 recorded transactions (average area 11.04 ha).
| Year | No. of sales | Average price | Median price | Avg. area |
|---|---|---|---|---|
| 2020 | 95 | €3,308/ha | €2,910/ha | 10.05 ha |
| 2021 | 191 | €3,234/ha | €2,933/ha | 9.88 ha |
| 2022 | 209 | €3,038/ha | €2,800/ha | 11.12 ha |
| 2023 | 208 | €3,221/ha | €2,814/ha | 10.54 ha |
| 2024 | 181 | €3,118/ha | €2,879/ha | 11.06 ha |
| 2025 | 170 | €3,183/ha | €3,065/ha | 11.04 ha |
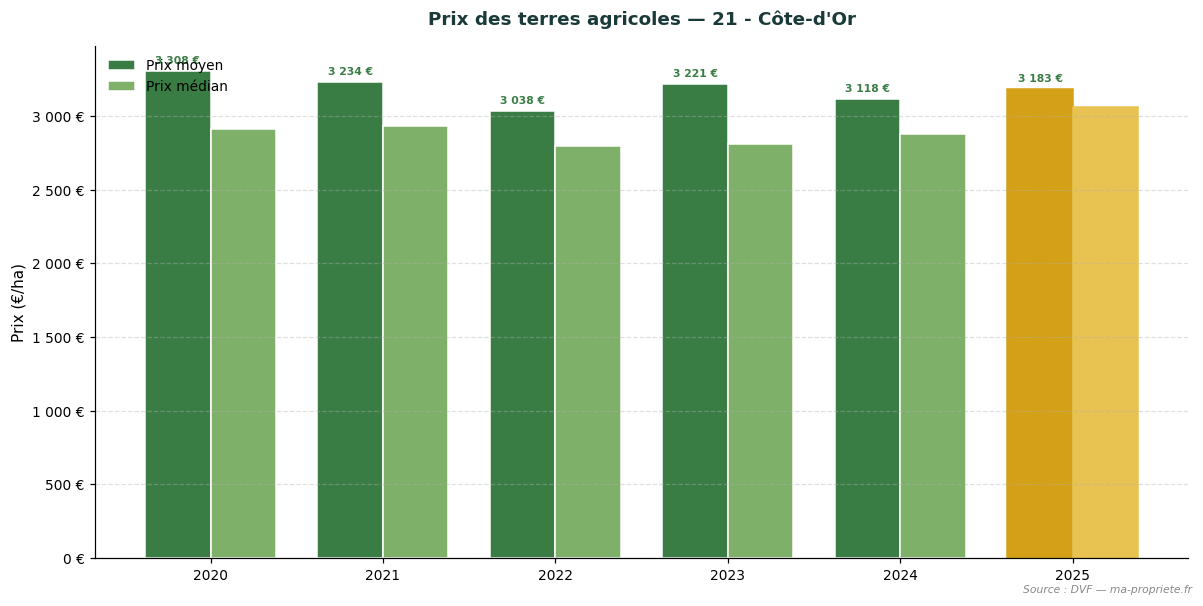
Trend in agricultural land prices — 21 - Côte-d'Or. Source: DVF, processed by ma-propriete.fr. The year 2025 is highlighted in golden colour.
The Doubs, at the heart of the PDO Comté area, is dominated by grasslands for mountain dairy farming. In 2025, the average price of agricultural land in the department stands at €3,569/ha (-2.2% compared to 2024). The median price reaches €3,314/ha, based on 132 recorded transactions (average area 7.68 ha).
| Year | No. of sales | Average price | Median price | Avg. area |
|---|---|---|---|---|
| 2020 | 61 | €3,232/ha | €2,957/ha | 7.79 ha |
| 2021 | 110 | €3,325/ha | €3,000/ha | 8.08 ha |
| 2022 | 117 | €3,182/ha | €3,000/ha | 9.03 ha |
| 2023 | 107 | €3,348/ha | €3,062/ha | 8.01 ha |
| 2024 | 124 | €3,649/ha | €3,199/ha | 7.78 ha |
| 2025 | 132 | €3,569/ha | €3,314/ha | 7.68 ha |
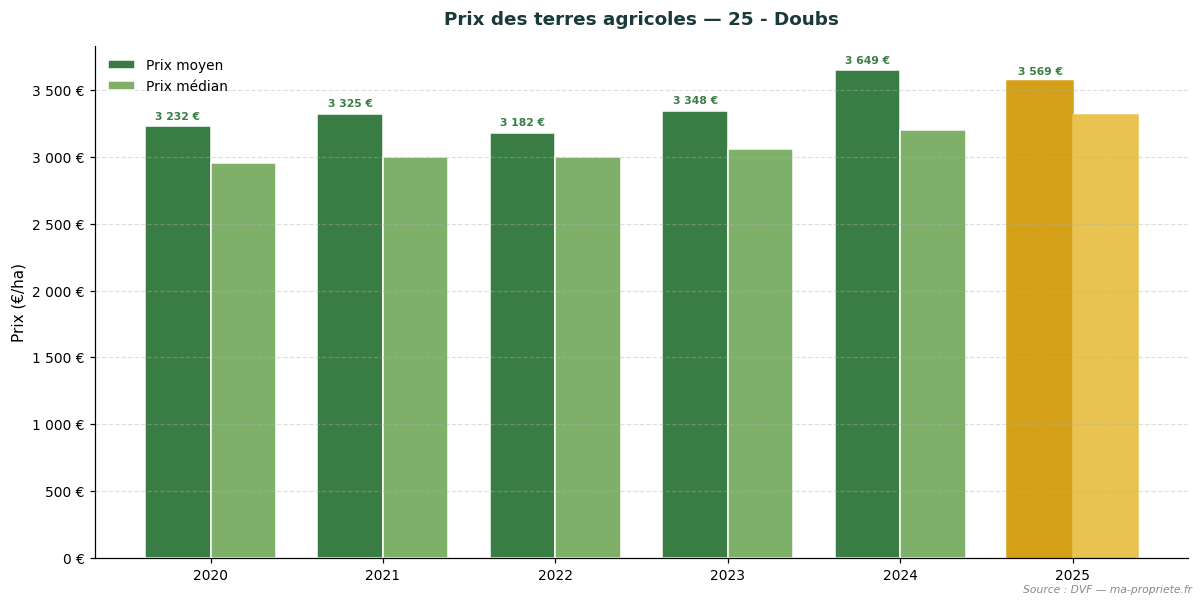
Trend in agricultural land prices — 25 - Doubs. Source: DVF, processed by ma-propriete.fr. The year 2025 is highlighted in golden colour.
The Jura, divided between the cereal-growing Revermont and the PDO dairy plateaus, presents segmented land markets. In 2025, the average price of agricultural land in the department stands at €2,546/ha (+3.7% compared to 2024). The median price reaches €2,304/ha, based on 124 recorded transactions (average area 8.39 ha).
| Year | No. of sales | Average price | Median price | Avg. area |
|---|---|---|---|---|
| 2020 | 72 | €2,478/ha | €2,377/ha | 7.93 ha |
| 2021 | 124 | €2,448/ha | €2,350/ha | 9.89 ha |
| 2022 | 137 | €2,442/ha | €2,212/ha | 9.41 ha |
| 2023 | 140 | €2,621/ha | €2,374/ha | 8.26 ha |
| 2024 | 130 | €2,456/ha | €2,269/ha | 7.81 ha |
| 2025 | 124 | €2,546/ha | €2,304/ha | 8.39 ha |
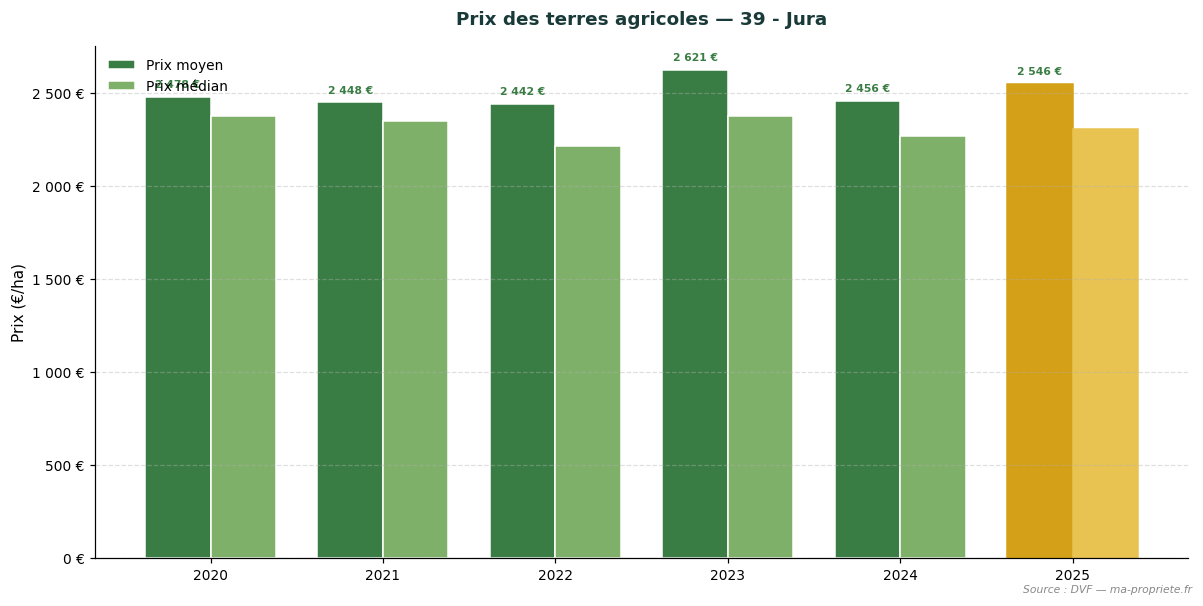
Trend in agricultural land prices — 39 - Jura. Source: DVF, processed by ma-propriete.fr. The year 2025 is highlighted in golden colour.
The Nièvre, a land of Charolais mixed crop-livestock farming, is distinguished by a high proportion of permanent grasslands. In 2025, the average price of agricultural land in the department stands at €3,182/ha (+2.8% compared to 2024). The median price reaches €3,040/ha, based on 150 recorded transactions (average area 13.61 ha).
| Year | No. of sales | Average price | Median price | Avg. area |
|---|---|---|---|---|
| 2020 | 76 | €3,051/ha | €2,921/ha | 13.77 ha |
| 2021 | 128 | €3,238/ha | €3,056/ha | 16.05 ha |
| 2022 | 165 | €3,038/ha | €3,000/ha | 13.93 ha |
| 2023 | 174 | €3,116/ha | €3,002/ha | 13.81 ha |
| 2024 | 155 | €3,095/ha | €3,000/ha | 11.73 ha |
| 2025 | 150 | €3,182/ha | €3,040/ha | 13.61 ha |
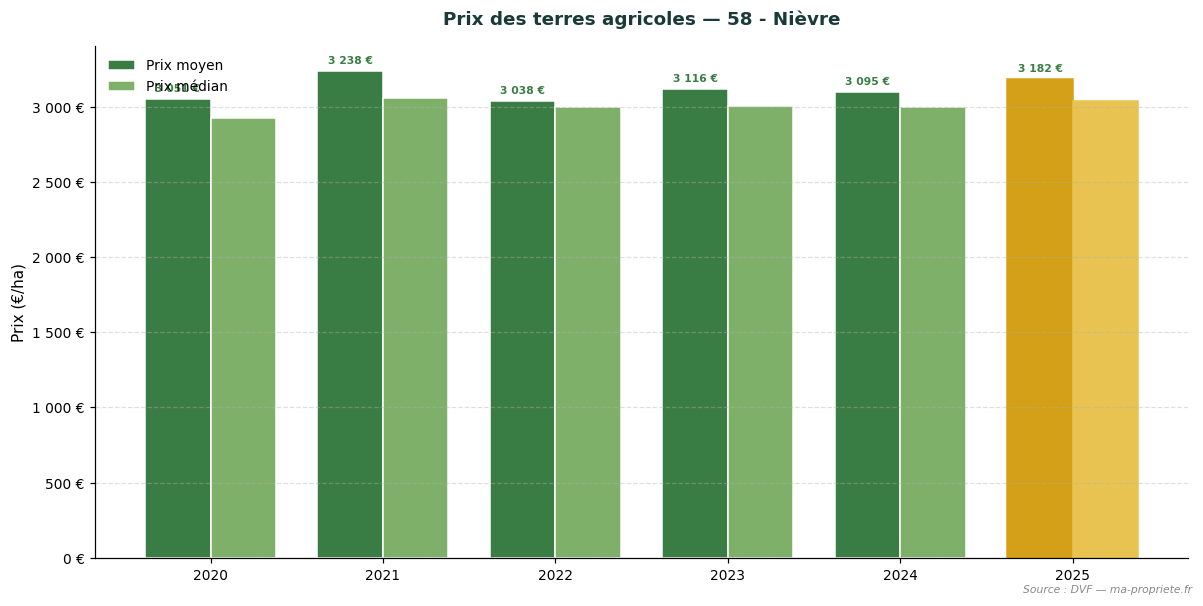
Trend in agricultural land prices — 58 - Nièvre. Source: DVF, processed by ma-propriete.fr. The year 2025 is highlighted in golden colour.
Haute-Saône combines beef cattle farming and arable cropping in the Saône valley. In 2025, the average price of agricultural land in the department stands at €2,727/ha (-3.1% compared to 2024). The median price reaches €2,615/ha, based on 156 recorded transactions (average area 8.87 ha).
| Year | No. of sales | Average price | Median price | Avg. area |
|---|---|---|---|---|
| 2020 | 53 | €2,857/ha | €2,700/ha | 9.52 ha |
| 2021 | 138 | €2,832/ha | €2,790/ha | 10.34 ha |
| 2022 | 155 | €2,734/ha | €2,600/ha | 9.13 ha |
| 2023 | 142 | €2,893/ha | €2,679/ha | 10.38 ha |
| 2024 | 141 | €2,813/ha | €2,750/ha | 10.71 ha |
| 2025 | 156 | €2,727/ha | €2,615/ha | 8.87 ha |
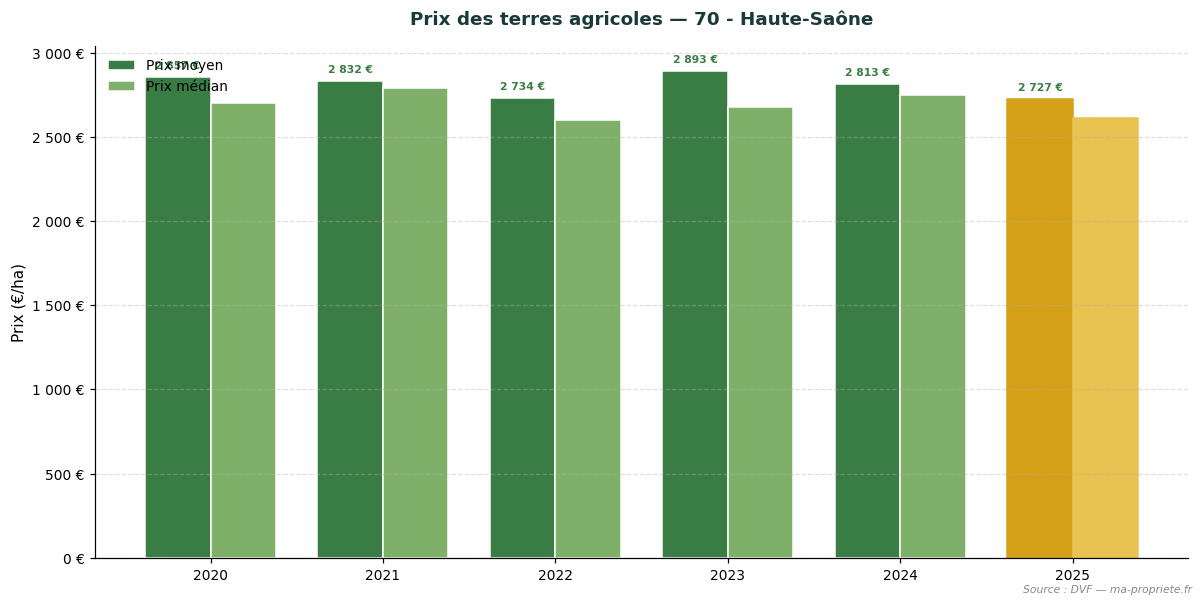
Trend in agricultural land prices — 70 - Haute-Saône. Source: DVF, processed by ma-propriete.fr. The year 2025 is highlighted in golden colour.
Saône-et-Loire is one of the largest Charolais farming areas in France, with a land market dominated by grasslands. In 2025, the average price of agricultural land in the department stands at €2,437/ha (+1.5% compared to 2024). The median price reaches €2,349/ha, based on 391 recorded transactions (average area 9.51 ha).
| Year | No. of sales | Average price | Median price | Avg. area |
|---|---|---|---|---|
| 2020 | 145 | €2,455/ha | €2,170/ha | 11.96 ha |
| 2021 | 306 | €2,343/ha | €2,181/ha | 10.49 ha |
| 2022 | 338 | €2,493/ha | €2,182/ha | 9.48 ha |
| 2023 | 319 | €2,433/ha | €2,111/ha | 11.11 ha |
| 2024 | 367 | €2,400/ha | €2,263/ha | 10.74 ha |
| 2025 | 391 | €2,437/ha | €2,349/ha | 9.51 ha |
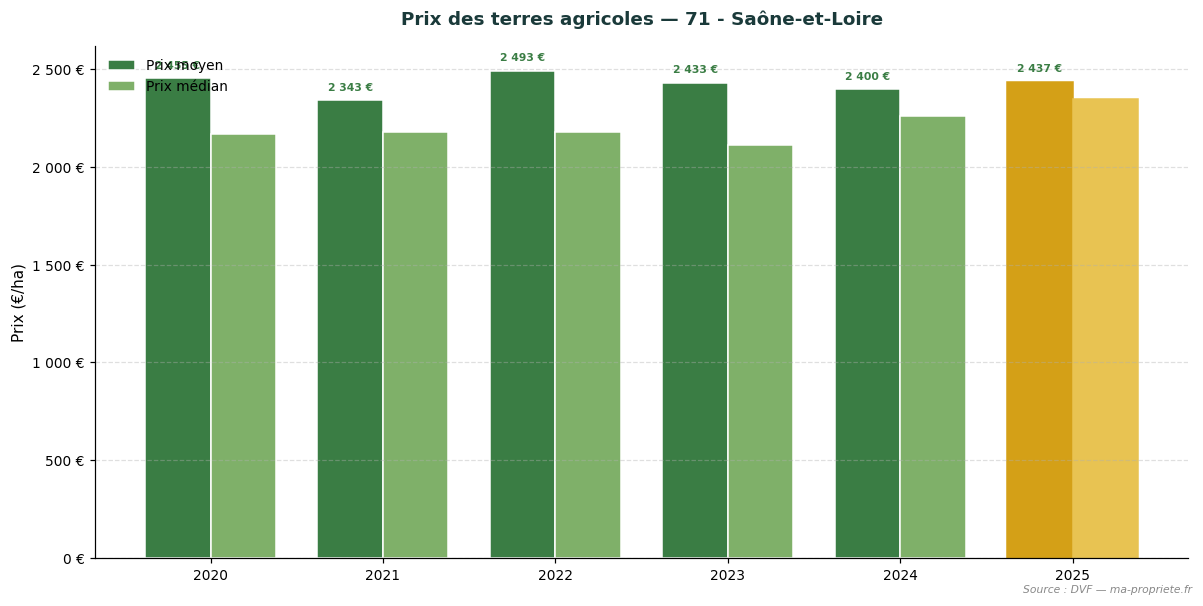
Trend in agricultural land prices — 71 - Saône-et-Loire. Source: DVF, processed by ma-propriete.fr. The year 2025 is highlighted in golden colour.
The Yonne, predominantly cereal-growing, approaches the standards of the Paris Basin on its northern plateaus. In 2025, the average price of agricultural land in the department stands at €3,294/ha (-2.8% compared to 2024). The median price reaches €3,094/ha, based on 164 recorded transactions (average area 14.14 ha).
| Year | No. of sales | Average price | Median price | Avg. area |
|---|---|---|---|---|
| 2020 | 72 | €3,192/ha | €2,903/ha | 14.21 ha |
| 2021 | 199 | €3,403/ha | €3,033/ha | 12.14 ha |
| 2022 | 212 | €3,368/ha | €3,088/ha | 10.78 ha |
| 2023 | 185 | €3,303/ha | €3,000/ha | 11.56 ha |
| 2024 | 180 | €3,390/ha | €3,110/ha | 13.44 ha |
| 2025 | 164 | €3,294/ha | €3,094/ha | 14.14 ha |
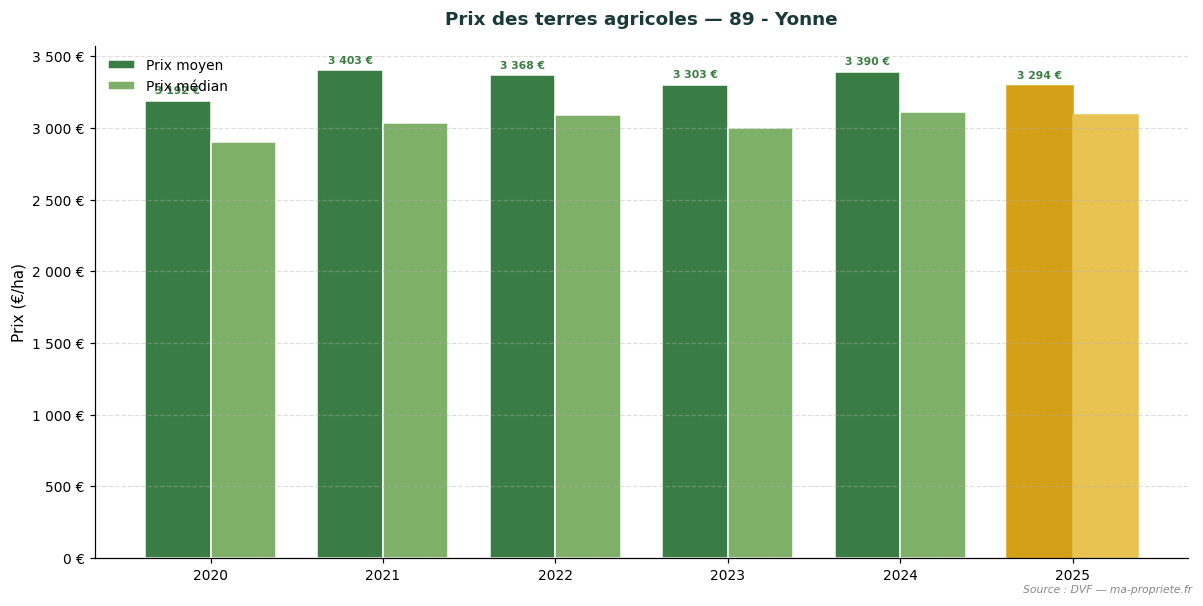
Trend in agricultural land prices — 89 - Yonne. Source: DVF, processed by ma-propriete.fr. The year 2025 is highlighted in golden colour.
The Territoire de Belfort, a smaller department, combines a few dairy and mixed farming operations. In 2025, the average price of agricultural land in the department stands at €4,011/ha (+13.8% compared to 2024). The median price reaches €3,820/ha, based on 16 recorded transactions (average area 6.54 ha). The low number of transactions (fewer than 30 sales) calls for caution when interpreting annual averages.
| Year | No. of sales | Average price | Median price | Avg. area |
|---|---|---|---|---|
| 2020 | 2 | €3,802/ha | €3,802/ha | 3.83 ha |
| 2021 | 7 | €3,766/ha | €3,700/ha | 7.97 ha |
| 2022 | 6 | €3,783/ha | €3,821/ha | 4.26 ha |
| 2023 | 10 | €3,660/ha | €3,706/ha | 7.51 ha |
| 2024 | 13 | €3,524/ha | €3,500/ha | 8.01 ha |
| 2025 | 16 | €4,011/ha | €3,820/ha | 6.54 ha |
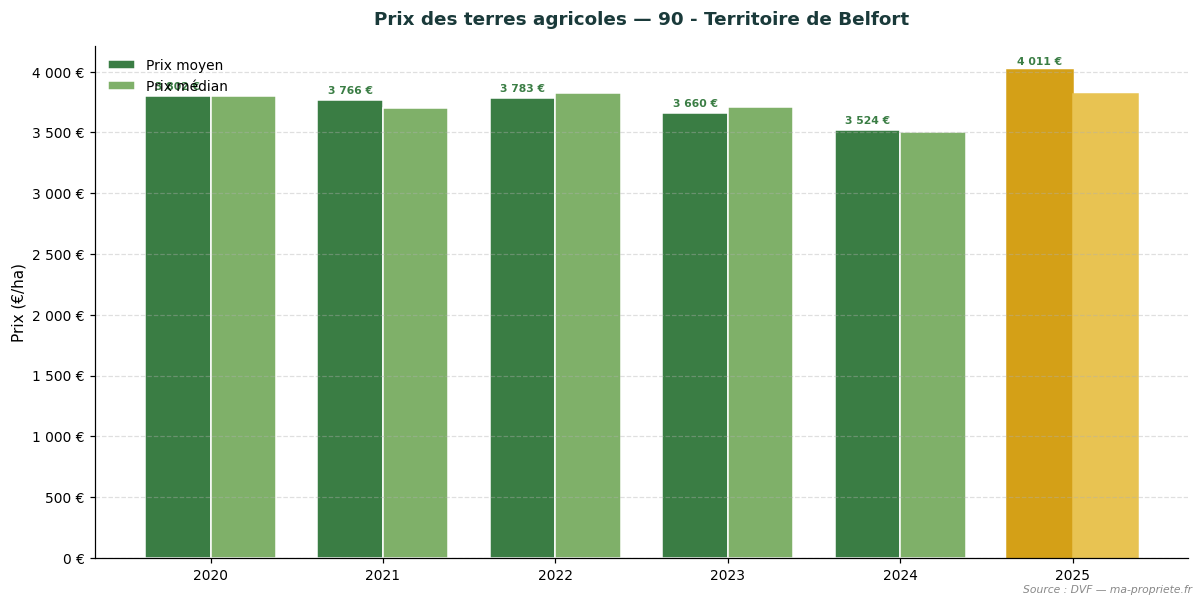
Trend in agricultural land prices — 90 - Territoire de Belfort. Source: DVF, processed by ma-propriete.fr. The year 2025 is highlighted in golden colour.
The statistics presented in this article are based on the DVF (Demandes de Valeurs Foncières) database, opened by the Directorate General of Public Finances. This database records all property transfers registered in metropolitan France and the overseas departments. We applied rigorous filtering to retain only transactions corresponding to strictly agricultural plots (arable land, grasslands, specialised crops excluding vineyards), systematically excluding built properties, vines and AOC vineyards, as well as mixed sales combining plots and buildings.
For each retained transaction, we calculate the price per hectare by dividing the declared land value by the area of the transferred property. Regional and departmental statistics then aggregate these unit values: average price, median price, first decile (P10) and ninth decile (P90), average area, and total number of annual sales.
The use of DVF data requires several methodological precautions.
The statistics published annually by the SAFERs (Sociétés d'aménagement foncier et d'établissement rural) and the Ministry of Agriculture differ from our DVF approach on several points. The SAFERs rely on transactions subject to their pre-emption rights or brokerage, which covers only a portion of the market. They also explicitly distinguish sales of vacant land (not occupied by a tenant farmer) from sales of tenanted land (already under a rural lease), with a structural discount of approximately 18% for the latter.
The DVF approach, more comprehensive, incorporates all recorded transfers without distinction as to tenancy status. This explains why average DVF levels may differ from SAFER publications, particularly in regions where the weight of tenanted sales is significant. We present both series in parallel to offer the most complete view possible of the agricultural land market.
The year 2025 confirms the stability of the agricultural land market in Bourgogne-Franche-Comté as a whole, with a regional average price of €2,907/ha (+0.1% vs 2024). Behind this average, the region's 8 departments show differentiated dynamics reflecting the diversity of terroirs and productive orientations. This is one of the most affordable regions in France. The weight of grasslands and livestock farming land pulls prices down, while the Yonne, more cereal-oriented, approaches the standards of the Paris Basin.
To regularly monitor the evolution of the agricultural land market, consult the agricultural land price observatory on ma-propriete.fr, as well as the agricultural section and the agricultural listings published on our portal.
To deepen the analysis of the French agricultural land market, find our articles dedicated to each region.