Updated on May 7, 2026: Find the most recent data on our Agricultural Land Price Observatory (DVF data 2020-2025), which presents average and median prices as well as transaction ranges for your region and each department.
Summary of the main DVF statistics for the year 2025, now fully available. The figures below cover exclusively agricultural land excluding vineyards (arable crops, grasslands, tillable land, specialised crops).
| Key figures 2025 — Pays de la Loire | |
|---|---|
| Average price | €3,842/ha |
| Median price | €3,267/ha |
| First decile (P10) | €1,990/ha |
| Ninth decile (P90) | €6,500/ha |
| Number of sales | 1,873 |
| Average area | 10.67 ha |
| Change vs 2024 | +3.4% |
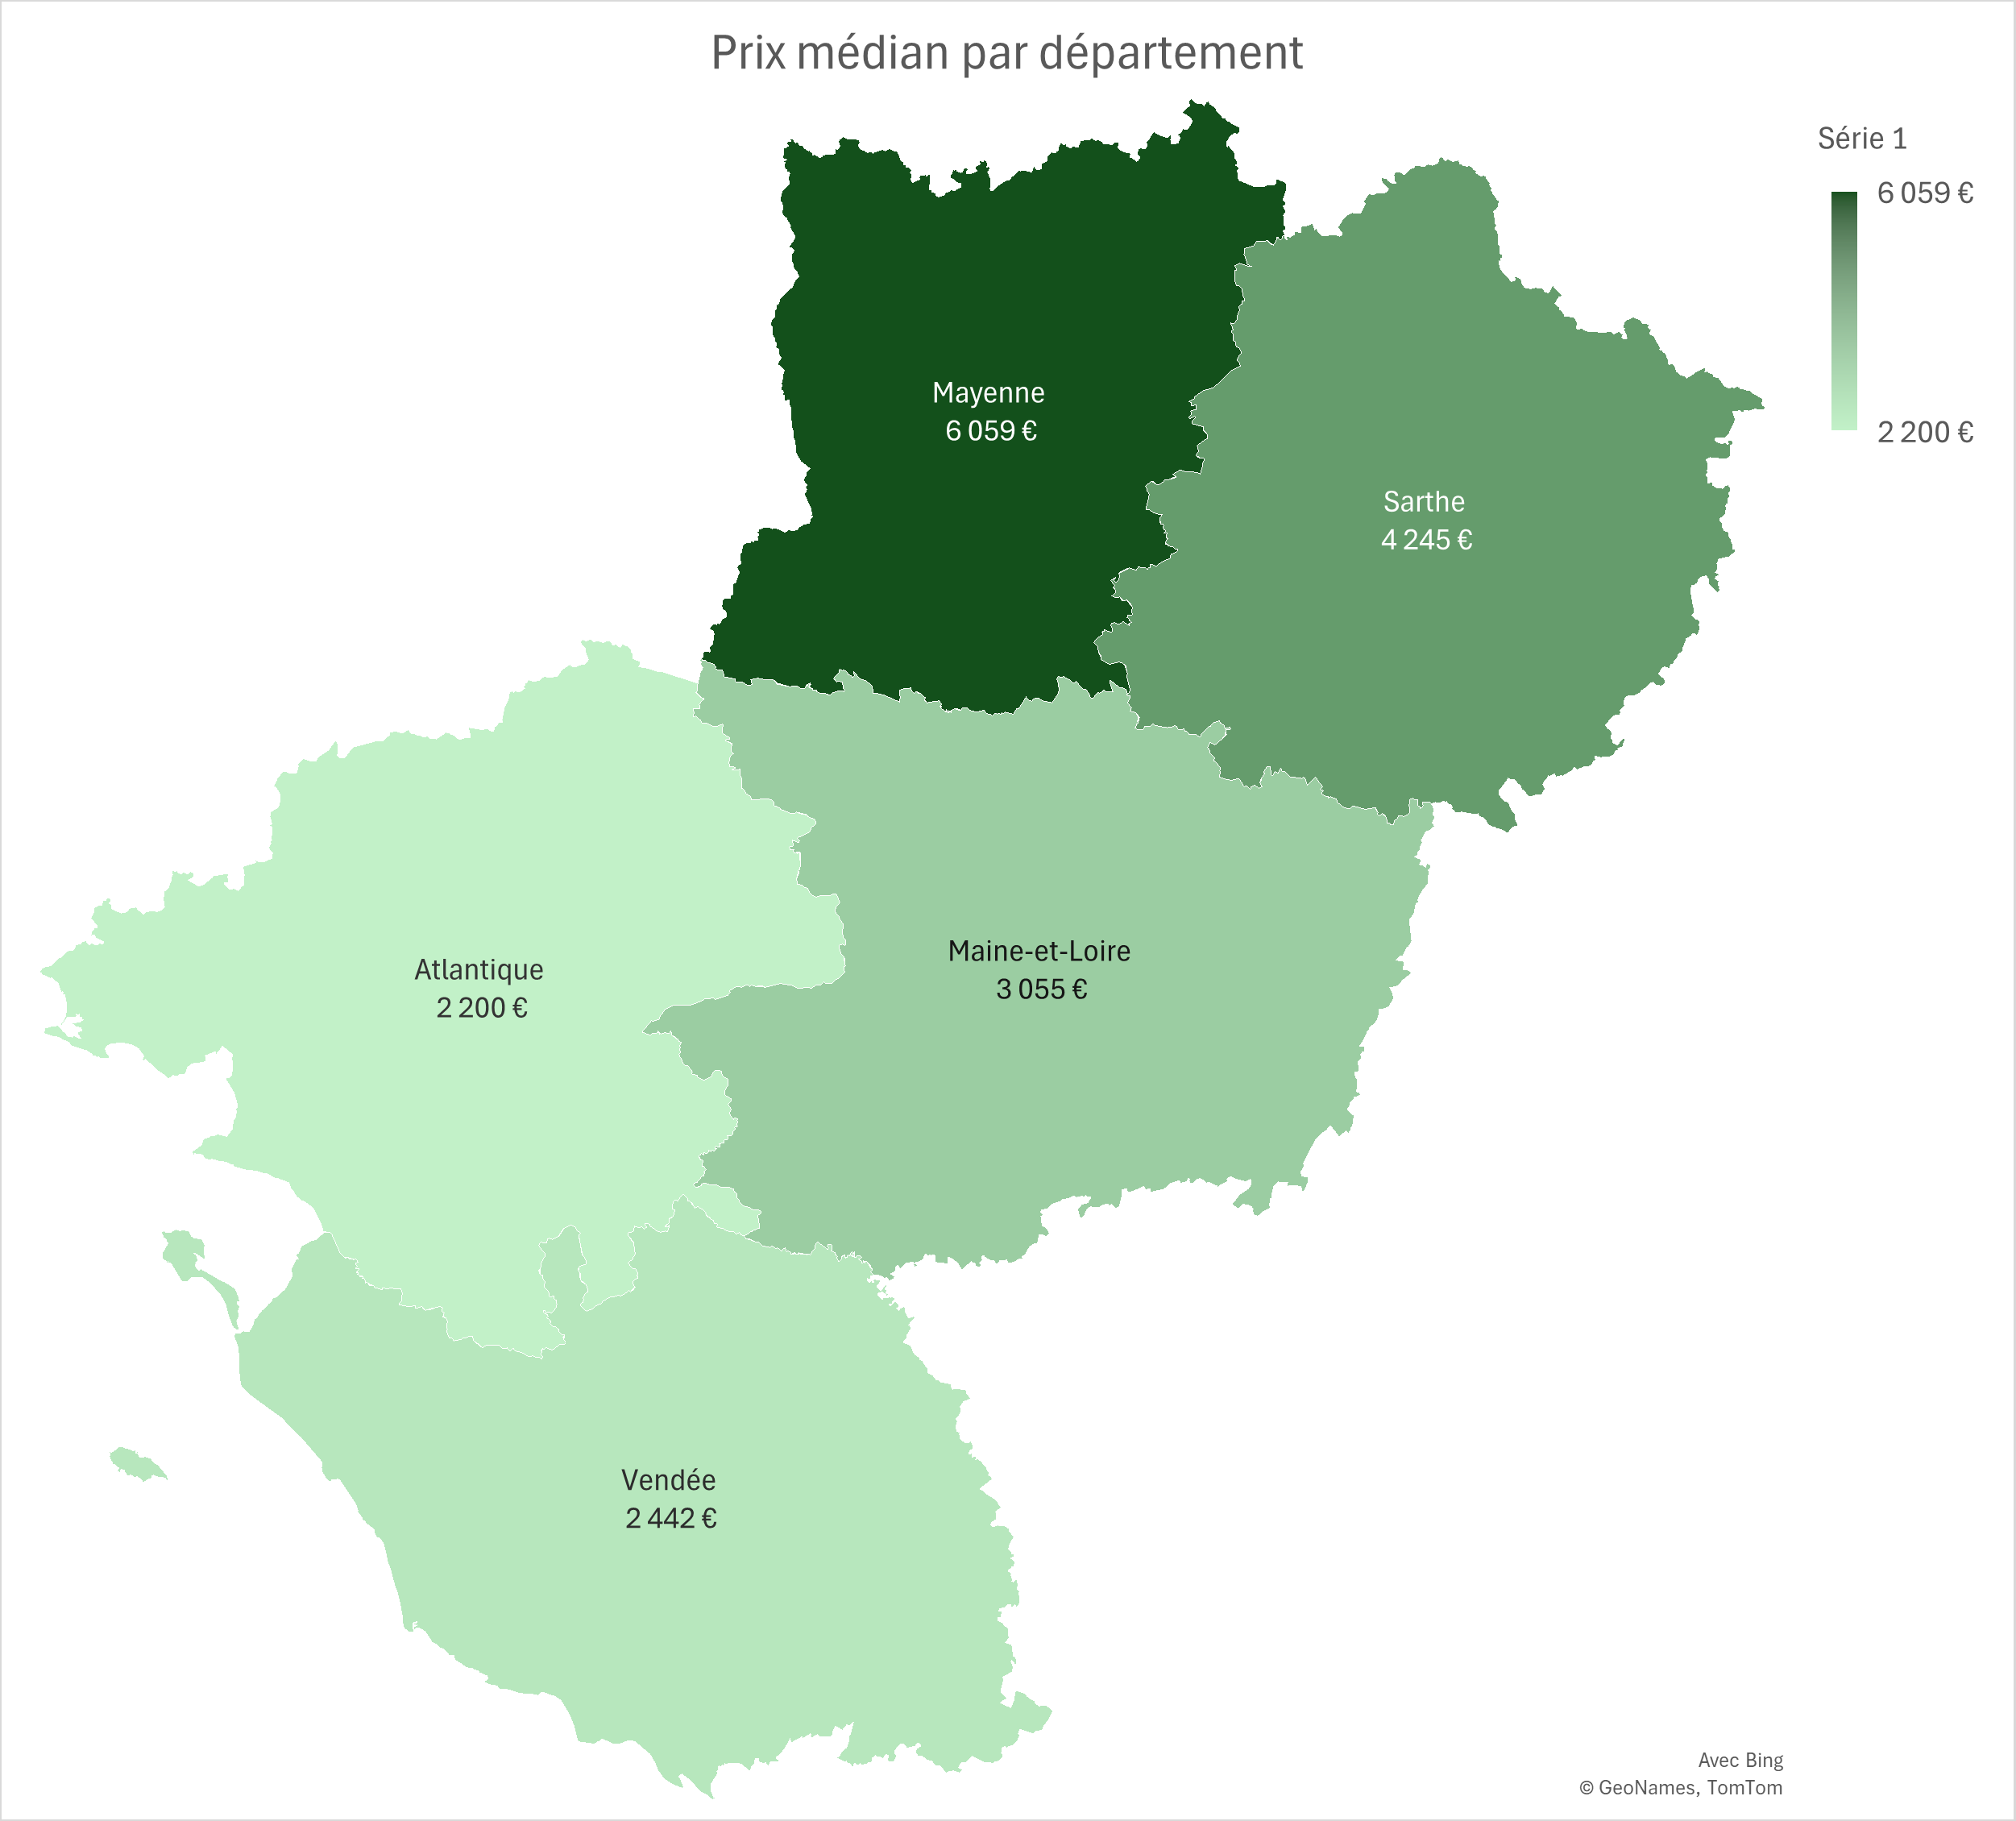
Pays de la Loire combines a strong tradition of cattle farming (Vendée, Mayenne, Maine-et-Loire) with cereal production in Sarthe and market gardening in the south of Loire-Atlantique. The regional UAA covers approximately 2.1 million hectares. The main regional agricultural orientations — dairy and beef cattle farming, poultry farming (Vendée), mixed crop-livestock farming, labelled productions (Loire-Atlantique, Maine-et-Loire), market gardening and fruit growing — shape a land market whose levels and dynamics differ greatly from one department to another.
This article presents agricultural land prices in Pays de la Loire based on DVF data (Demandes de Valeurs Foncières — Property Value Requests) processed by ma-propriete.fr, supplemented by Ministry of Agriculture publications sourced from the SAFERs. The year 2025, now fully available, is commented on as a priority; 2024 serves as a comparative reference. The Loire Valley vineyards (Muscadet, Anjou, Saumur, Coteaux du Layon) are expressly excluded from the scope of this article.
In 2025, the average price of agricultural land in Pays de la Loire stands at €3,842/ha, representing a change of +3.4% compared to 2024. The median price, a less sensitive indicator to extreme transactions, reaches €3,267/ha. Over the full year, 1,873 transactions were recorded in the region with an average area per sale of 10.67 ha.
The gap between the first decile (€1,990/ha) and the ninth decile (€6,500/ha) — a P90/P10 ratio of 3.3 — illustrates the dispersion of prices within the region. This dispersion reflects the heterogeneity of terroirs, the diversity of productive orientations and the variability of land pressure across different areas.
Over the 2021–2025 period (the first years fully covered by DVF), the regional average price is up (+4.8%).
| Year | Number of sales | Average price | Median price | P10 | P90 | Average area |
|---|---|---|---|---|---|---|
| 2020 | 947 | €3,668/ha | €3,000/ha | €1,700/ha | €6,500/ha | 11.02 ha |
| 2021 | 1,881 | €3,666/ha | €3,068/ha | €1,700/ha | €6,396/ha | 10.29 ha |
| 2022 | 1,916 | €3,867/ha | €3,193/ha | €1,800/ha | €6,803/ha | 11.47 ha |
| 2023 | 2,011 | €3,745/ha | €3,077/ha | €1,806/ha | €6,500/ha | 10.97 ha |
| 2024 | 1,846 | €3,715/ha | €3,044/ha | €1,900/ha | €6,283/ha | 10.80 ha |
| 2025 | 1,873 | €3,842/ha | €3,267/ha | €1,990/ha | €6,500/ha | 10.67 ha |
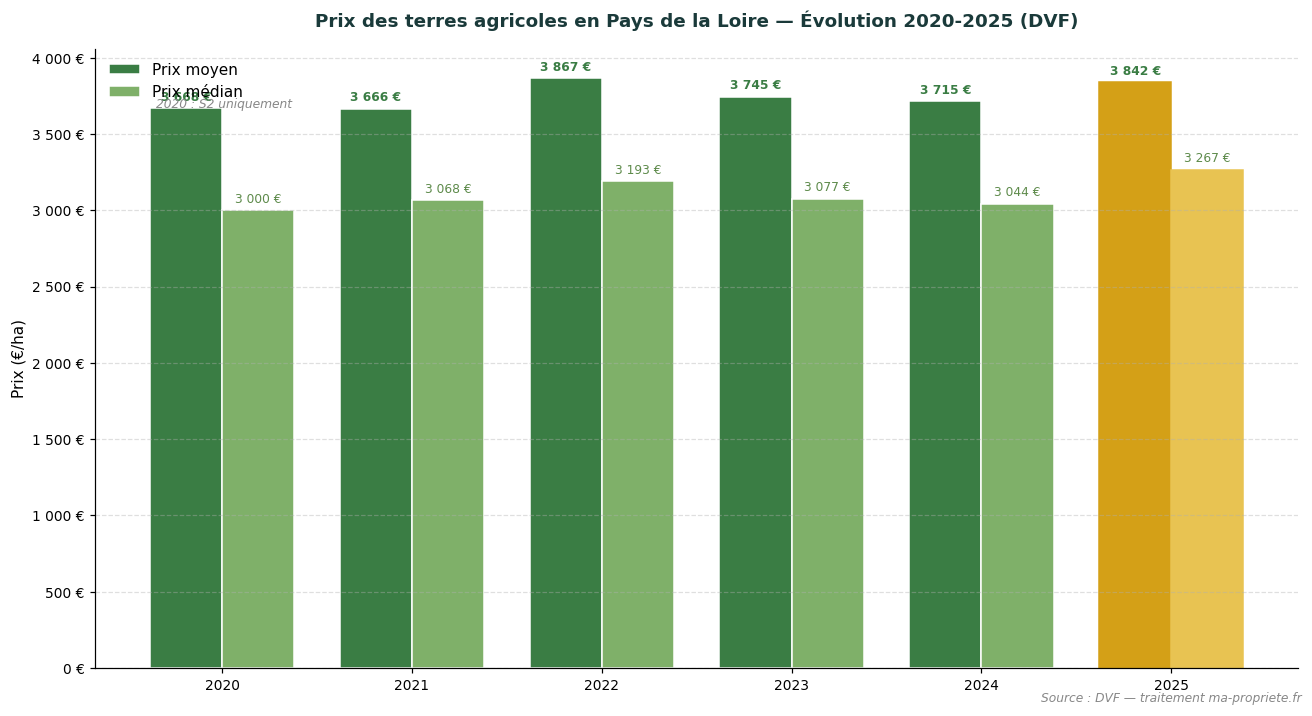
Trend in average and median agricultural land prices in Pays de la Loire (2020–2025). Source: DVF, processed by ma-propriete.fr. The year 2025 is highlighted in golden colour.
The SAFERs publish an annual summary of agricultural land prices, distinguishing between sales of vacant land (parcels not occupied by a tenant farmer) and sales of tenanted land (parcels already under a rural lease). In Pays de la Loire, the latest available year is 2024: the average price of vacant land reaches €4,040/ha, compared with €3,340/ha for tenanted land. In 2024, the gap between vacant and tenanted land reaches 17% in Pays de la Loire, in line with the national average (~18%).
| Year | Vacant land (SAFER) | Tenanted land (SAFER) |
|---|---|---|
| 2015 | €3,670/ha | €2,810/ha |
| 2018 | €3,780/ha | €3,040/ha |
| 2020 | €4,000/ha | €3,060/ha |
| 2022 | €3,900/ha | €3,180/ha |
| 2023 | €4,060/ha | €3,290/ha |
| 2024 | €4,040/ha | €3,340/ha |
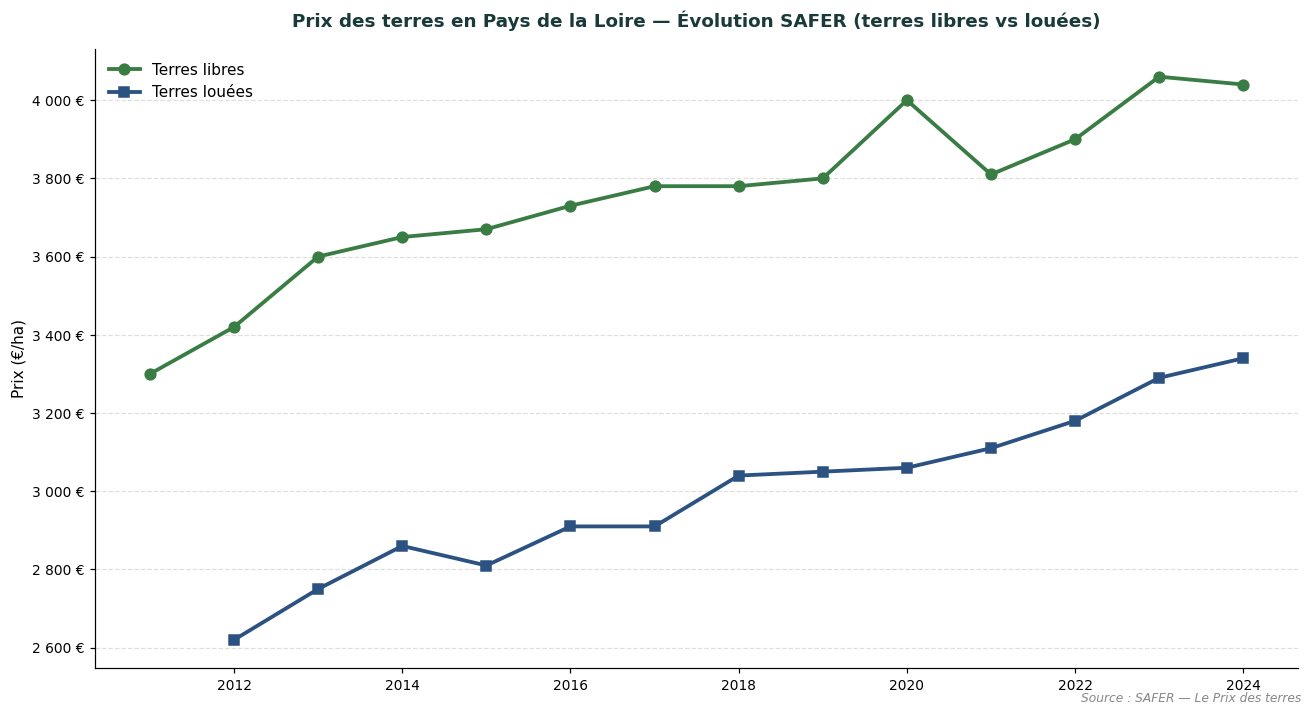
Comparative trend in vacant and tenanted land prices in Pays de la Loire. Source: SAFER — Le Prix des terres.
The SAFER figures are not directly comparable to the DVF figures presented above: the SAFER only covers part of the market (transactions subject to pre-emption rights or intermediation), whereas DVF captures all recorded transfers. The two sources are complementary and allow the land market to be assessed from two distinct angles.
Loire-Atlantique combines dairy farming, beef cattle farming and market gardening, with strong peri-urban pressure around Nantes. In 2025, the average price of agricultural land in the department stands at €2,476/ha (-1.7% compared to 2024). The median price reaches €2,200/ha, based on 380 recorded transactions (average area 9.98 ha).
| Year | No. of sales | Average price | Median price | Avg. area |
|---|---|---|---|---|
| 2020 | 241 | €2,191/ha | €2,000/ha | 10.91 ha |
| 2021 | 405 | €2,334/ha | €2,000/ha | 8.96 ha |
| 2022 | 404 | €2,521/ha | €2,131/ha | 9.69 ha |
| 2023 | 427 | €2,482/ha | €2,100/ha | 9.57 ha |
| 2024 | 397 | €2,520/ha | €2,294/ha | 9.97 ha |
| 2025 | 380 | €2,476/ha | €2,200/ha | 9.98 ha |
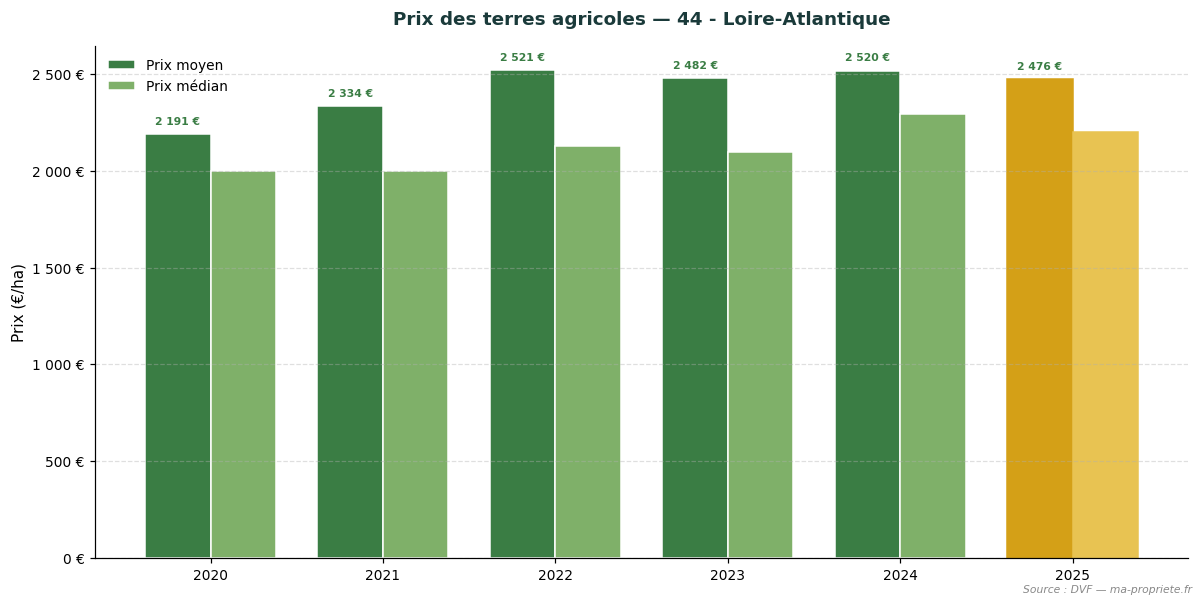
Trend in agricultural land prices — 44 - Loire-Atlantique. Source: DVF, processed by ma-propriete.fr. The year 2025 is highlighted in golden colour.
Maine-et-Loire combines specialised crop production (seeds, horticulture), livestock farming and fruit growing. In 2025, the average price of agricultural land in the department stands at €3,388/ha (+2.0% compared to 2024). The median price reaches €3,055/ha, based on 408 recorded transactions (average area 11.33 ha).
| Year | No. of sales | Average price | Median price | Avg. area |
|---|---|---|---|---|
| 2020 | 193 | €3,388/ha | €3,000/ha | 10.68 ha |
| 2021 | 361 | €3,155/ha | €2,962/ha | 10.22 ha |
| 2022 | 387 | €3,264/ha | €3,000/ha | 11.77 ha |
| 2023 | 379 | €3,314/ha | €3,097/ha | 11.86 ha |
| 2024 | 416 | €3,322/ha | €3,042/ha | 11.14 ha |
| 2025 | 408 | €3,388/ha | €3,055/ha | 11.33 ha |
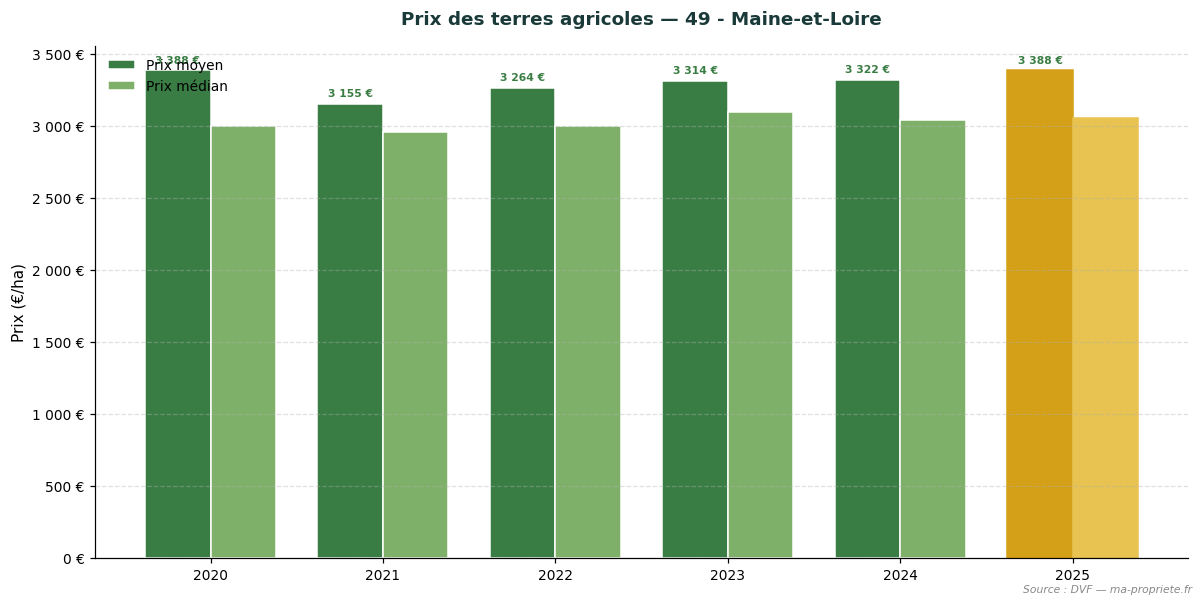
Trend in agricultural land prices — 49 - Maine-et-Loire. Source: DVF, processed by ma-propriete.fr. The year 2025 is highlighted in golden colour.
Mayenne is one of France's principal dairy farming areas, structured around permanent grasslands. In 2025, the average price of agricultural land in the department stands at €6,502/ha (+0.0% compared to 2024). The median price reaches €6,059/ha, based on 343 recorded transactions (average area 11.57 ha).
| Year | No. of sales | Average price | Median price | Avg. area |
|---|---|---|---|---|
| 2020 | 196 | €6,012/ha | €5,674/ha | 11.22 ha |
| 2021 | 402 | €5,988/ha | €5,719/ha | 11.95 ha |
| 2022 | 416 | €6,399/ha | €6,216/ha | 13.32 ha |
| 2023 | 387 | €6,410/ha | €6,000/ha | 11.97 ha |
| 2024 | 298 | €6,499/ha | €6,001/ha | 12.37 ha |
| 2025 | 343 | €6,502/ha | €6,059/ha | 11.57 ha |
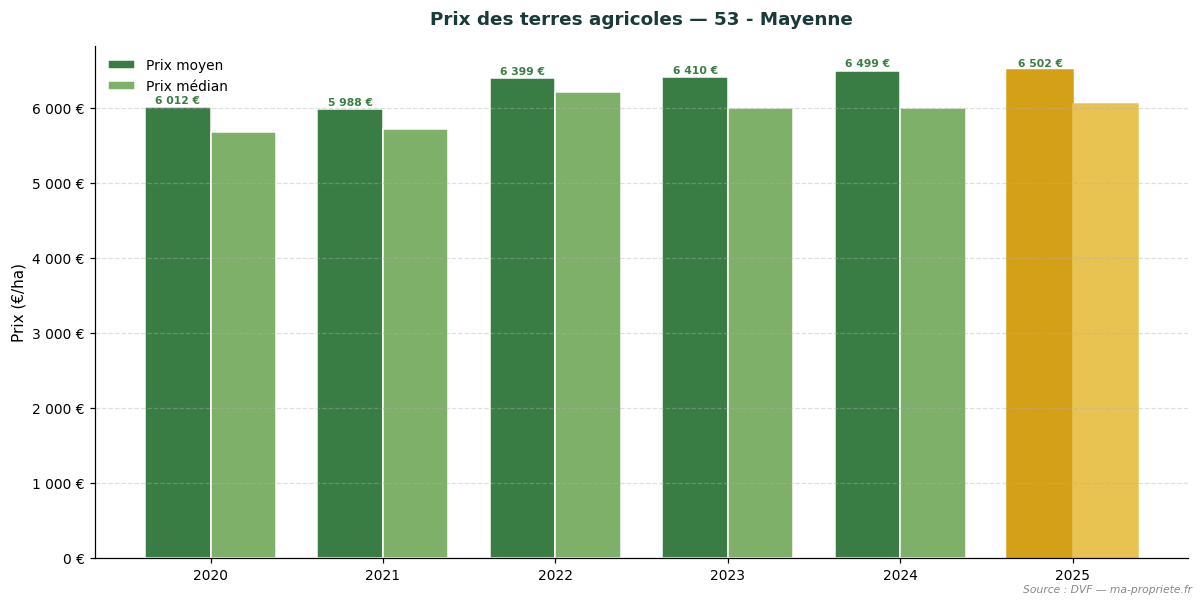
Trend in agricultural land prices — 53 - Mayenne. Source: DVF, processed by ma-propriete.fr. The year 2025 is highlighted in golden colour.
Sarthe combines cereal arable farming with beef and dairy cattle farming. In 2025, the average price of agricultural land in the department stands at €4,629/ha (+0.1% compared to 2024). The median price reaches €4,245/ha, based on 346 recorded transactions (average area 10.41 ha).
| Year | No. of sales | Average price | Median price | Avg. area |
|---|---|---|---|---|
| 2020 | 143 | €4,553/ha | €4,358/ha | 10.12 ha |
| 2021 | 317 | €4,476/ha | €4,178/ha | 10.10 ha |
| 2022 | 327 | €4,535/ha | €4,010/ha | 9.71 ha |
| 2023 | 342 | €4,453/ha | €4,013/ha | 9.99 ha |
| 2024 | 309 | €4,626/ha | €4,215/ha | 9.11 ha |
| 2025 | 346 | €4,629/ha | €4,245/ha | 10.41 ha |
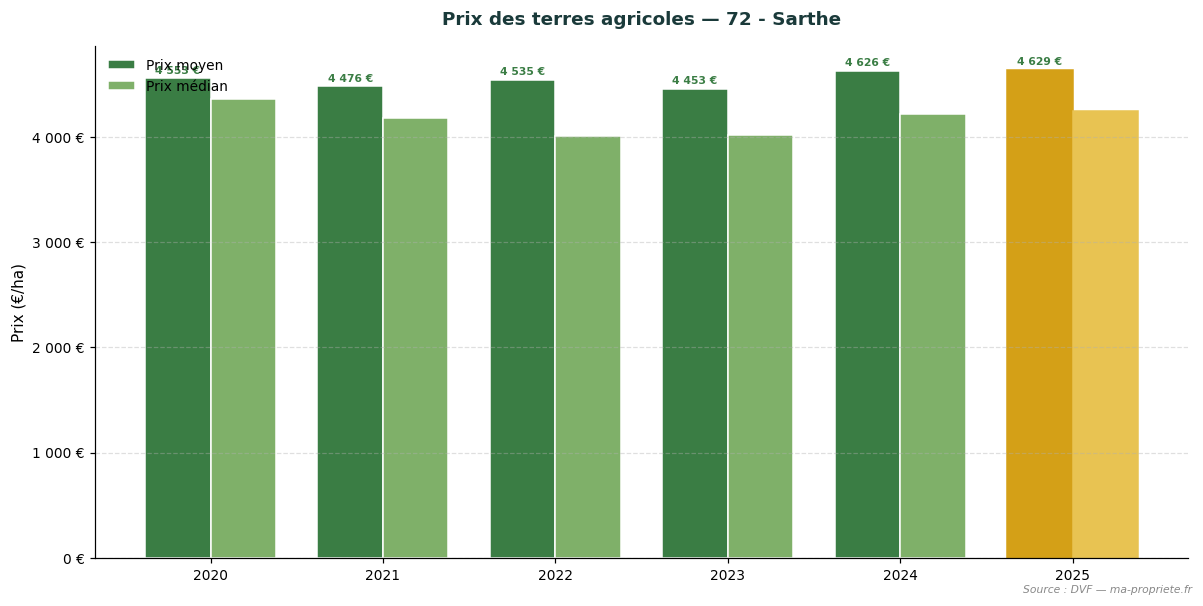
Trend in agricultural land prices — 72 - Sarthe. Source: DVF, processed by ma-propriete.fr. The year 2025 is highlighted in golden colour.
Vendée combines poultry farming, cattle farming and arable crops, with one of the most accessible markets in the region. In 2025, the average price of agricultural land in the department stands at €2,626/ha (+0.8% compared to 2024). The median price reaches €2,442/ha, based on 396 recorded transactions (average area 10.10 ha).
| Year | No. of sales | Average price | Median price | Avg. area |
|---|---|---|---|---|
| 2020 | 174 | €2,659/ha | €2,334/ha | 12.04 ha |
| 2021 | 396 | €2,490/ha | €2,225/ha | 10.16 ha |
| 2022 | 382 | €2,571/ha | €2,294/ha | 12.53 ha |
| 2023 | 476 | €2,545/ha | €2,358/ha | 11.39 ha |
| 2024 | 426 | €2,604/ha | €2,396/ha | 11.38 ha |
| 2025 | 396 | €2,626/ha | €2,442/ha | 10.10 ha |
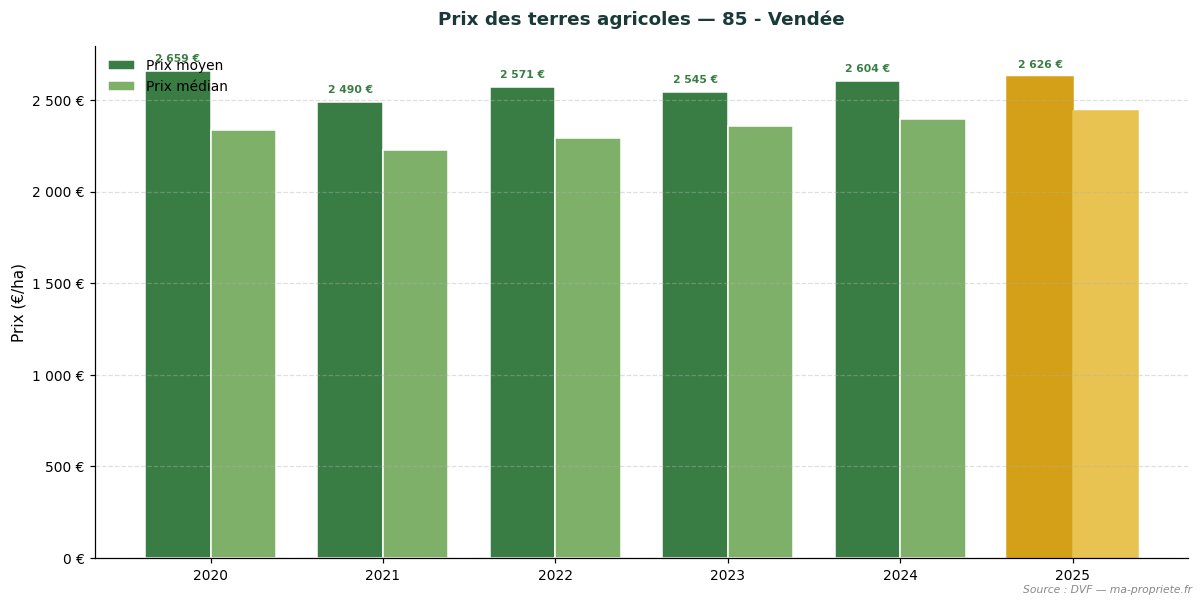
Trend in agricultural land prices — 85 - Vendée. Source: DVF, processed by ma-propriete.fr. The year 2025 is highlighted in golden colour.
The statistics presented in this article are based on the DVF database (Demandes de Valeurs Foncières — Property Value Requests), made available by the Directorate General of Public Finances. This database records all real estate property transfers registered in metropolitan France and the overseas departments. We applied rigorous filtering to retain only transactions corresponding to strictly agricultural parcels (arable land, grasslands, specialised crops excluding vineyards), systematically excluding built properties, vineyards and AOC wine estates, as well as mixed sales combining parcels and buildings.
For each retained transaction, we calculate the price per hectare by dividing the declared property value by the area of the transferred asset. The regional and departmental statistics then aggregate these unit values: average price, median price, first decile (P10) and ninth decile (P90), average area, as well as the total number of annual sales.
The use of DVF data requires several methodological precautions.
The statistics published annually by the SAFERs (Sociétés d'aménagement foncier et d'établissement rural — Rural Land Development and Settlement Corporations) and the Ministry of Agriculture differ from our DVF approach on several points. The SAFERs rely on transactions subject to their pre-emption rights or intermediation, which covers only a portion of the market. They also explicitly distinguish between sales of vacant land (not occupied by a tenant farmer) and sales of tenanted land (already under a rural lease), with a structural discount of approximately 18% for the latter.
The DVF approach, more comprehensive, incorporates all recorded transfers without distinction as to tenancy status. This explains why average DVF levels may differ from SAFER publications, particularly in regions where the weight of tenanted sales is significant. We present both series in parallel to offer the most complete possible view of the agricultural land market.
The year 2025 confirms the stability of the agricultural land market in Pays de la Loire as a whole, with a regional average price of €3,842/ha (+3.4% vs 2024). Behind this average, the region's 5 departments show differentiated dynamics that reflect the diversity of terroirs and productive orientations. Pays de la Loire displays prices among the most accessible in western France. Vendée and Loire-Atlantique pull the average downward due to the weight of permanent grasslands and extensive farming systems.
To regularly monitor the evolution of the agricultural land market, consult the agricultural land price observatory on ma-propriete.fr, as well as the agricultural section and the agricultural listings published on our portal.
To deepen the analysis of the French agricultural land market, explore our articles dedicated to each region.