Updated on May 7, 2026: Find the most recent data on our Agricultural Land Price Observatory (DVF data 2020-2025), which presents average and median prices as well as transaction ranges for your region and each department.
Summary of the main DVF statistics for 2025, now fully available. The figures below cover exclusively agricultural land excluding vineyards (arable crops, grasslands, ploughable land, specialised crops).
| Key figures 2025 — Occitanie | |
|---|---|
| Average price | €7,653/ha |
| Median price | €7,015/ha |
| First decile (P10) | €3,913/ha |
| Ninth decile (P90) | €11,825/ha |
| Number of sales | 995 |
| Average area | 10.42 ha |
| Change vs 2024 | -5.2% |
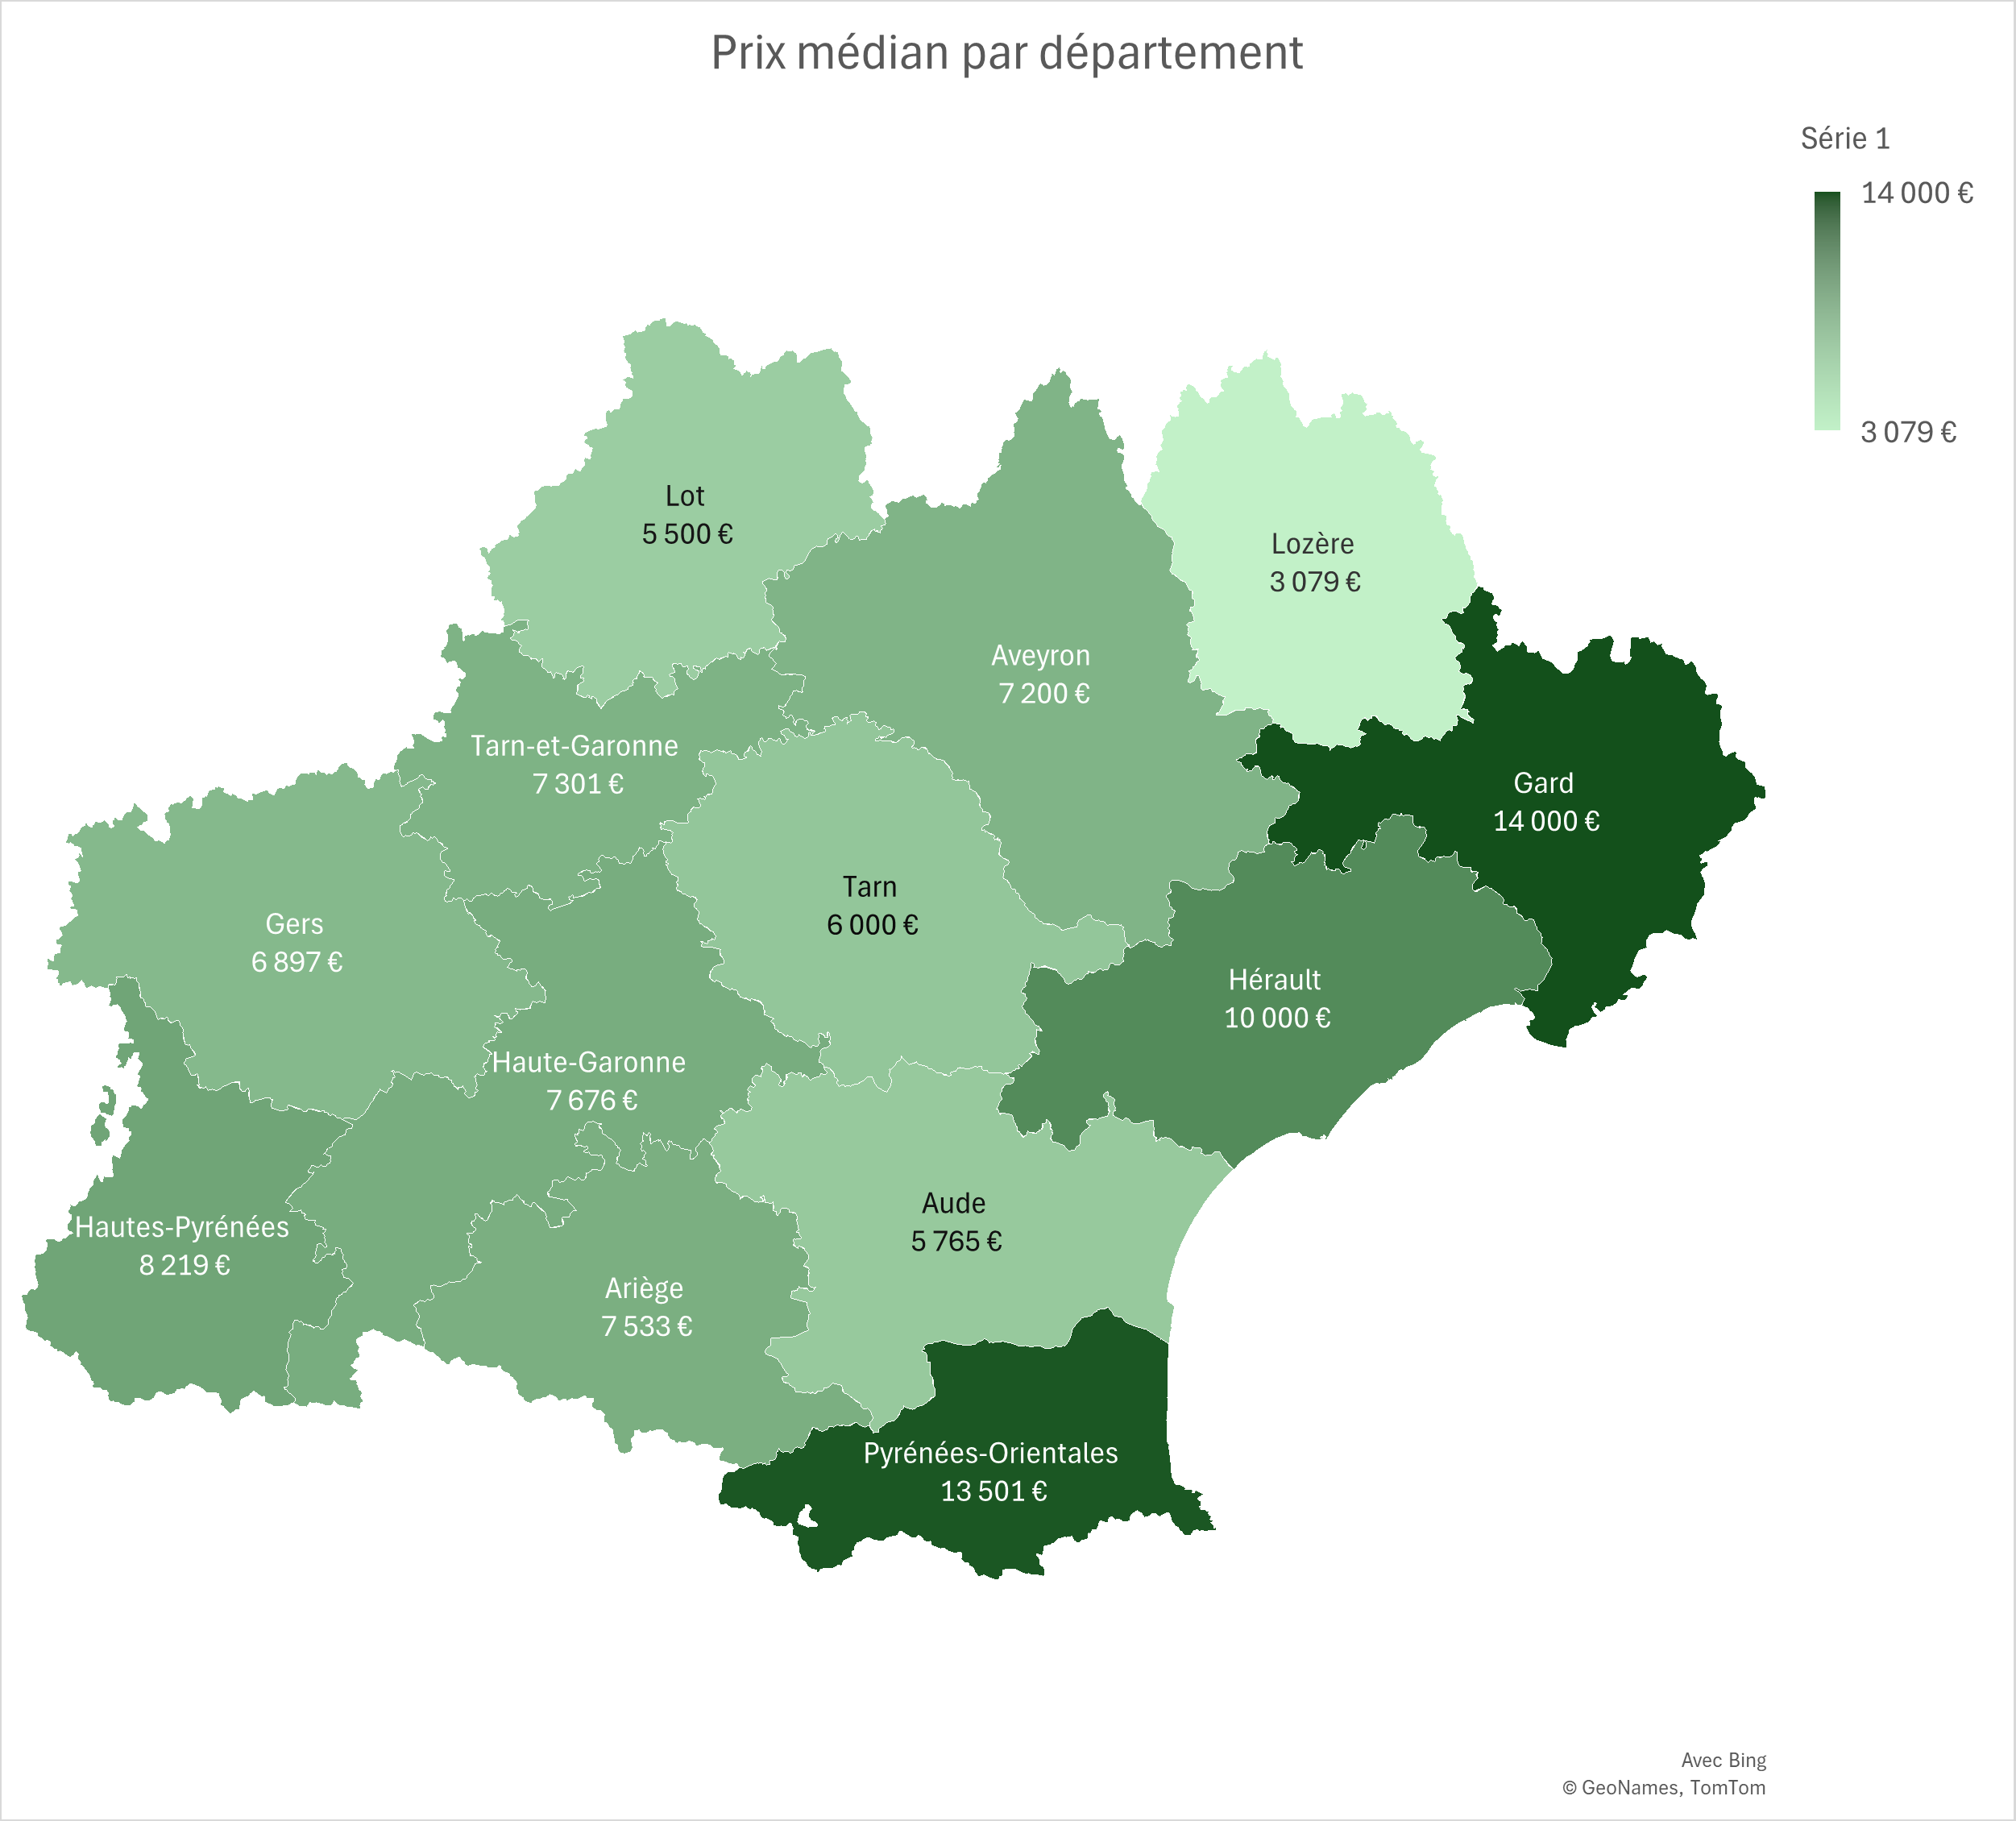
Occitanie is one of the most agriculturally diverse regions in France: arable crops in the Gers and Tarn-et-Garonne, extensive livestock farming on the Causses and Pyrenees, Mediterranean productions in the lowlands. The utilised agricultural area (UAA) of Occitanie exceeds 3 million hectares. The region's main agricultural orientations — cereals (durum wheat, irrigated maize), oilseed and protein crops (sunflower, soya), sheep and cattle farming, fruit growing (apple, apricot), market gardening, Mediterranean productions — structure a land market whose price levels and dynamics vary considerably from one department to another.
This article presents agricultural land prices in Occitanie based on DVF (Demandes de Valeurs Foncières) data processed by ma-propriete.fr, supplemented by publications from the Ministry of Agriculture sourced from the SAFERs. The year 2025, now fully available, is analysed as a priority; 2024 serves as a comparative reference. The Languedoc vineyard area (Languedoc, Costières de Nîmes, Roussillon, Gaillac) constitutes a specific market expressly excluded from the scope of this article.
In 2025, the average price of agricultural land in Occitanie stands at €7,653/ha, representing a change of -5.2% compared to 2024. The median price, an indicator less sensitive to extreme transactions, reaches €7,015/ha. Over the full year, 995 transactions were recorded in the region, with an average area per sale of 10.42 ha.
The gap between the first decile (€3,913/ha) and the ninth decile (€11,825/ha) — a P90/P10 ratio of 3.0 — illustrates the dispersion of prices within the region. This dispersion reflects the heterogeneity of terroirs, the diversity of production orientations and the variability of land pressure depending on the area.
Over the 2021–2025 period (the first years fully covered by DVF), the regional average price has risen (+5.4%).
| Year | Number of sales | Average price | Median price | P10 | P90 | Average area |
|---|---|---|---|---|---|---|
| 2020 | 458 | €7,633/ha | €7,000/ha | €4,265/ha | €11,282/ha | 11.52 ha |
| 2021 | 989 | €7,260/ha | €6,804/ha | €3,631/ha | €11,325/ha | 10.40 ha |
| 2022 | 1,109 | €7,455/ha | €7,000/ha | €3,802/ha | €11,363/ha | 10.05 ha |
| 2023 | 1,065 | €7,527/ha | €7,160/ha | €3,974/ha | €11,078/ha | 10.94 ha |
| 2024 | 1,026 | €8,069/ha | €7,320/ha | €4,000/ha | €12,000/ha | 10.10 ha |
| 2025 | 995 | €7,653/ha | €7,015/ha | €3,913/ha | €11,825/ha | 10.42 ha |
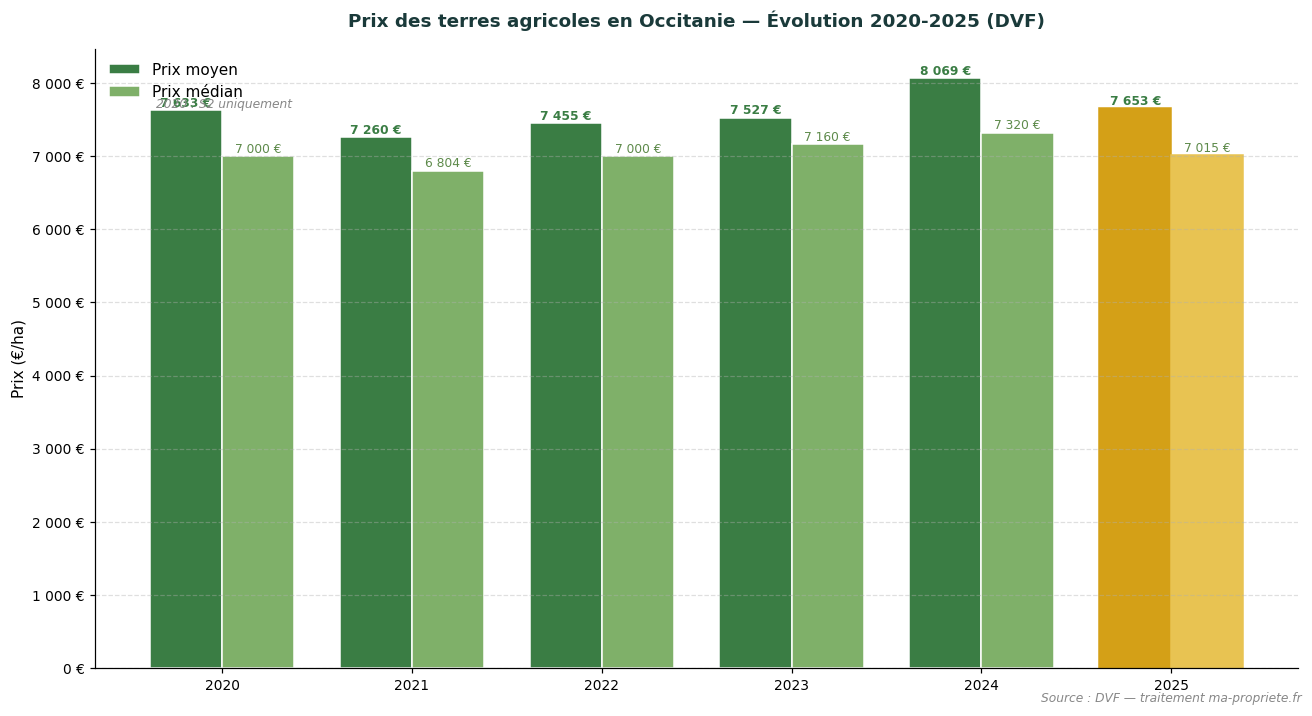
Trend in average and median agricultural land prices in Occitanie (2020–2025). Source: DVF, processed by ma-propriete.fr. The year 2025 is highlighted in gold.
The SAFERs publish an annual summary of agricultural land prices, distinguishing between sales of vacant land (plots not occupied by a tenant farmer) and sales of tenanted land (plots already under a rural lease). In Occitanie, the latest available year is 2024: the average price of vacant land reaches €7,280/ha, while tenanted land data is not available (insufficient volume).
| Year | Vacant land (SAFER) | Tenanted land (SAFER) |
|---|---|---|
| 2015 | €6,840/ha | — |
| 2018 | €7,090/ha | — |
| 2020 | €6,890/ha | — |
| 2022 | €7,000/ha | — |
| 2023 | €7,230/ha | — |
| 2024 | €7,280/ha | — |
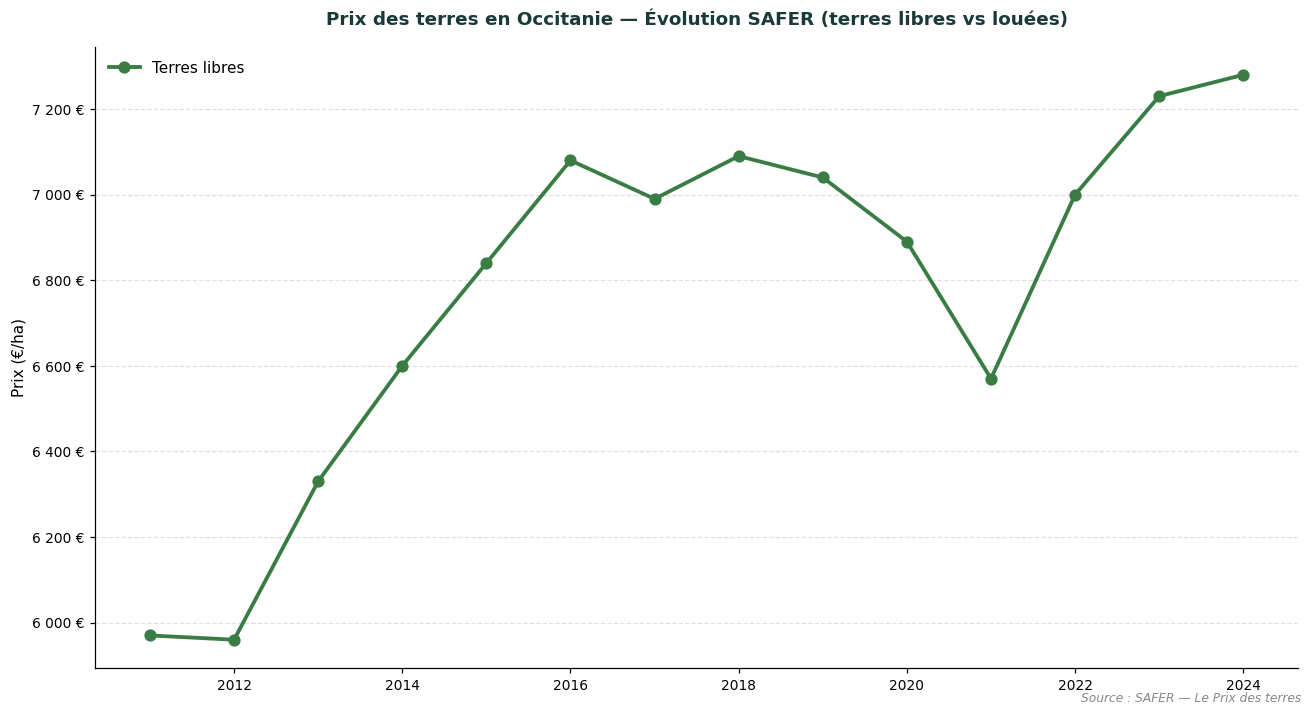
Comparative trend in vacant and tenanted land prices in Occitanie. Source: SAFER — Le Prix des terres.
The SAFER figures are not directly comparable to the DVF figures presented above: the SAFER only covers part of the market (transactions subject to pre-emption rights or its intermediation), whereas DVF captures all registered transfers. The two sources are complementary and allow the land market to be assessed from two distinct perspectives.
Ariège combines extensive livestock farming and mountain productions, with a limited land market. In 2025, the average price of agricultural land in the department stands at €7,099/ha (+2.1% compared to 2024). The median price reaches €7,533/ha, based on 26 recorded transactions (average area 14.01 ha). The low number of transactions (fewer than 30 sales) calls for caution when interpreting annual averages.
| Year | No. of sales | Average price | Median price | Avg. area |
|---|---|---|---|---|
| 2020 | 10 | €6,096/ha | €6,286/ha | 16.51 ha |
| 2021 | 28 | €4,844/ha | €4,666/ha | 7.26 ha |
| 2022 | 41 | €5,809/ha | €5,824/ha | 10.27 ha |
| 2023 | 38 | €5,661/ha | €5,037/ha | 13.10 ha |
| 2024 | 41 | €6,955/ha | €6,268/ha | 10.28 ha |
| 2025 | 26 | €7,099/ha | €7,533/ha | 14.01 ha |
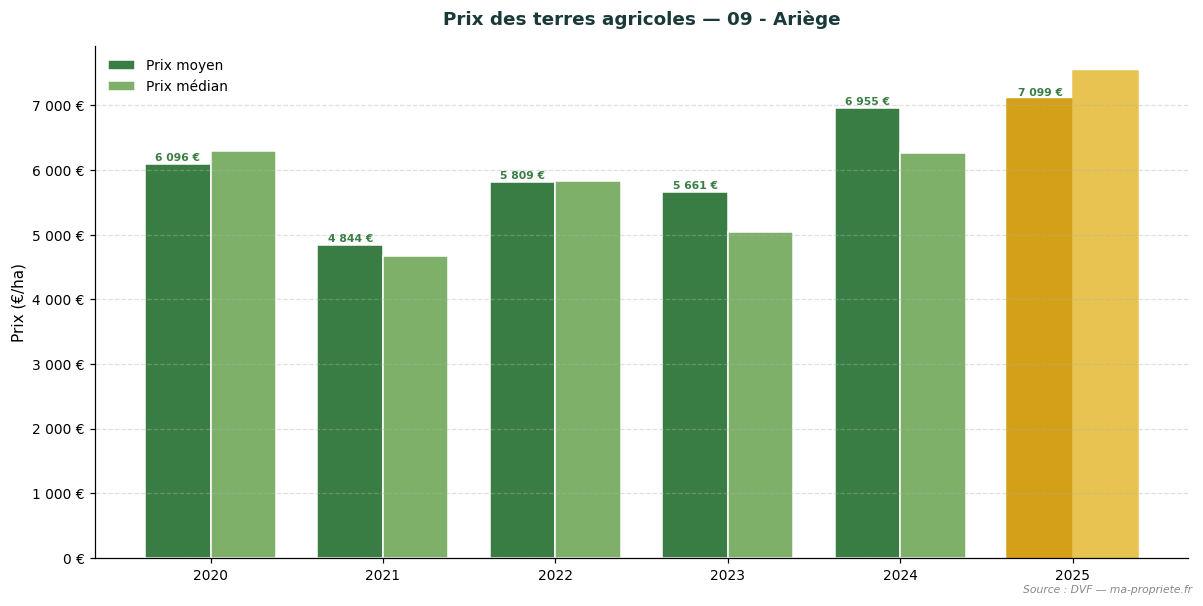
Trend in agricultural land prices — 09 - Ariège. Source: DVF, processed by ma-propriete.fr. The year 2025 is highlighted in gold.
Aude (excluding viticulture) combines cereal arable farming and extensive livestock farming in the Corbières. In 2025, the average price of agricultural land in the department stands at €6,627/ha (-4.6% compared to 2024). The median price reaches €5,765/ha, based on 59 recorded transactions (average area 10.71 ha).
| Year | No. of sales | Average price | Median price | Avg. area |
|---|---|---|---|---|
| 2020 | 23 | €6,392/ha | €5,727/ha | 19.05 ha |
| 2021 | 69 | €6,346/ha | €5,737/ha | 8.65 ha |
| 2022 | 69 | €6,232/ha | €5,835/ha | 13.16 ha |
| 2023 | 73 | €5,866/ha | €5,809/ha | 10.65 ha |
| 2024 | 55 | €6,944/ha | €7,116/ha | 8.52 ha |
| 2025 | 59 | €6,627/ha | €5,765/ha | 10.71 ha |
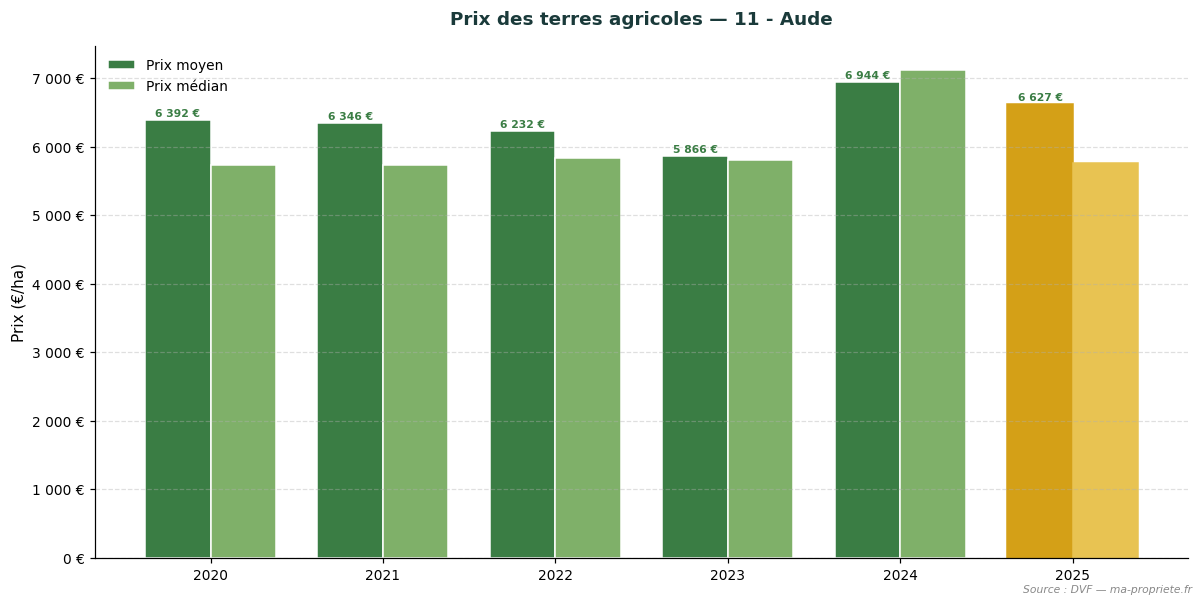
Trend in agricultural land prices — 11 - Aude. Source: DVF, processed by ma-propriete.fr. The year 2025 is highlighted in gold.
Aveyron, the leading dairy sheep department (Roquefort), structures its market around grasslands. In 2025, the average price of agricultural land in the department stands at €7,868/ha (+5.5% compared to 2024). The median price reaches €7,200/ha, based on 107 recorded transactions (average area 8.48 ha).
| Year | No. of sales | Average price | Median price | Avg. area |
|---|---|---|---|---|
| 2020 | 43 | €7,903/ha | €7,421/ha | 7.71 ha |
| 2021 | 78 | €7,400/ha | €6,874/ha | 7.84 ha |
| 2022 | 95 | €7,884/ha | €7,636/ha | 7.36 ha |
| 2023 | 99 | €7,539/ha | €7,160/ha | 7.03 ha |
| 2024 | 102 | €7,456/ha | €7,459/ha | 6.77 ha |
| 2025 | 107 | €7,868/ha | €7,200/ha | 8.48 ha |
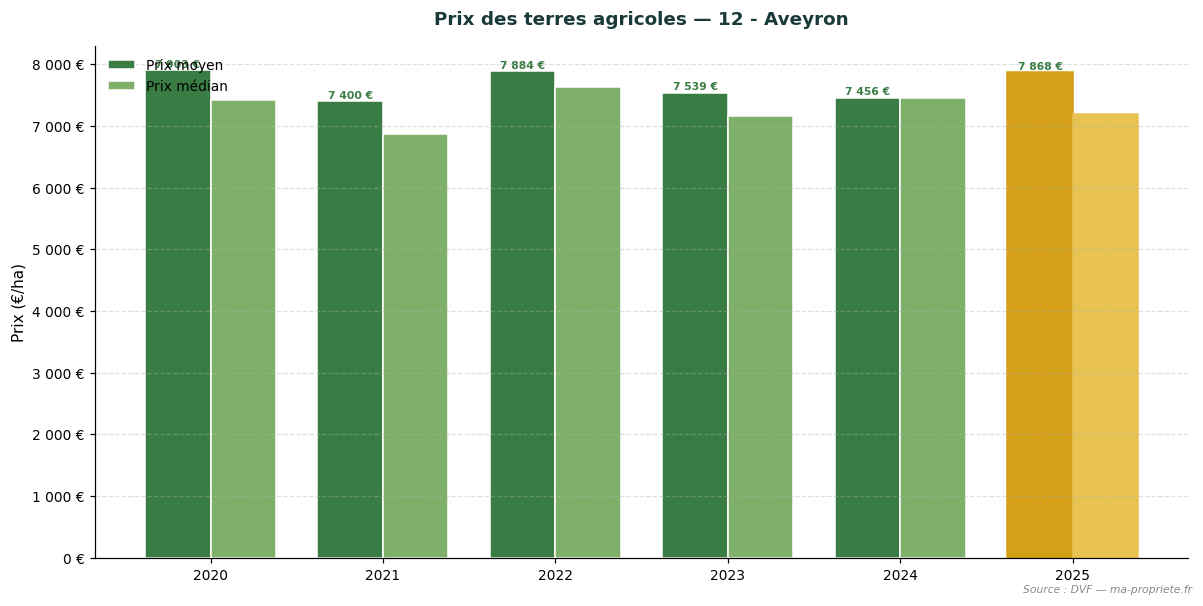
Trend in agricultural land prices — 12 - Aveyron. Source: DVF, processed by ma-propriete.fr. The year 2025 is highlighted in gold.
Gard (excluding viticulture) encompasses fruit growing, market gardening and Mediterranean productions. In 2025, the average price of agricultural land in the department stands at €13,165/ha (-7.1% compared to 2024). The median price reaches €14,000/ha, based on 39 recorded transactions (average area 11.29 ha).
| Year | No. of sales | Average price | Median price | Avg. area |
|---|---|---|---|---|
| 2020 | 25 | €11,639/ha | €11,775/ha | 10.98 ha |
| 2021 | 45 | €10,125/ha | €10,000/ha | 7.22 ha |
| 2022 | 55 | €12,352/ha | €11,416/ha | 10.37 ha |
| 2023 | 40 | €10,439/ha | €10,000/ha | 13.22 ha |
| 2024 | 42 | €14,171/ha | €13,000/ha | 6.62 ha |
| 2025 | 39 | €13,165/ha | €14,000/ha | 11.29 ha |
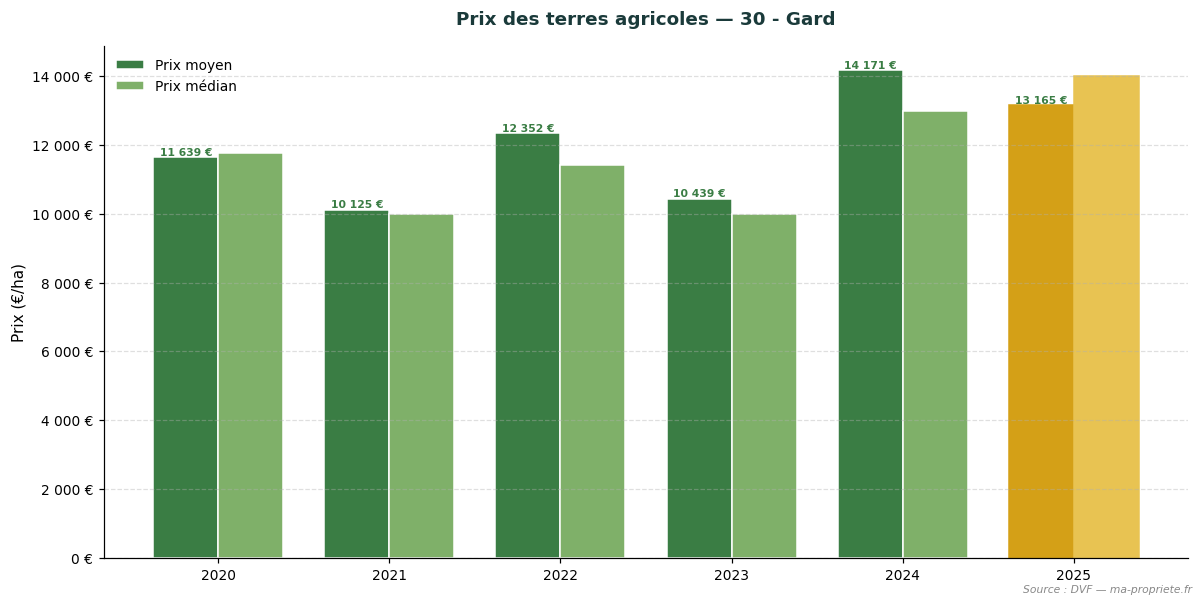
Trend in agricultural land prices — 30 - Gard. Source: DVF, processed by ma-propriete.fr. The year 2025 is highlighted in gold.
Haute-Garonne, predominantly arable in the Lauragais area, presents a diversified land market. In 2025, the average price of agricultural land in the department stands at €7,903/ha (-1.1% compared to 2024). The median price reaches €7,676/ha, based on 154 recorded transactions (average area 10.50 ha).
| Year | No. of sales | Average price | Median price | Avg. area |
|---|---|---|---|---|
| 2020 | 67 | €8,376/ha | €7,888/ha | 10.45 ha |
| 2021 | 162 | €7,451/ha | €7,028/ha | 9.92 ha |
| 2022 | 163 | €7,698/ha | €7,670/ha | 11.16 ha |
| 2023 | 167 | €8,096/ha | €7,980/ha | 9.85 ha |
| 2024 | 177 | €7,991/ha | €7,623/ha | 10.18 ha |
| 2025 | 154 | €7,903/ha | €7,676/ha | 10.50 ha |
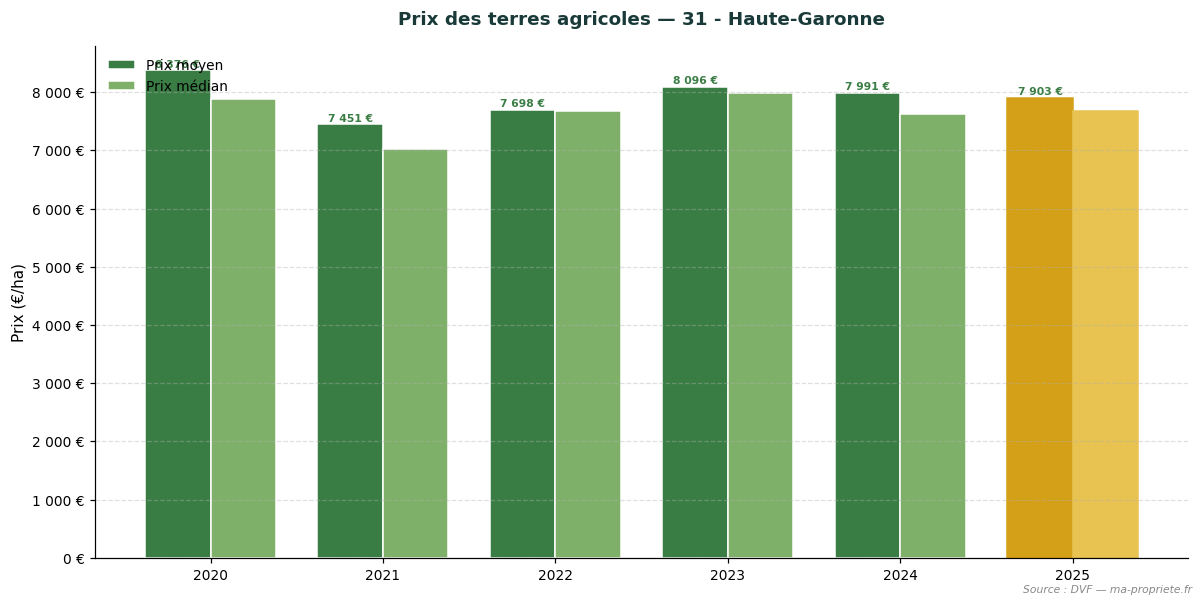
Trend in agricultural land prices — 31 - Haute-Garonne. Source: DVF, processed by ma-propriete.fr. The year 2025 is highlighted in gold.
Gers is one of the major cereal-growing basins of the South-West, dominated by arable crops. In 2025, the average price of agricultural land in the department stands at €6,763/ha (-4.4% compared to 2024). The median price reaches €6,897/ha, based on 248 recorded transactions (average area 12.64 ha).
| Year | No. of sales | Average price | Median price | Avg. area |
|---|---|---|---|---|
| 2020 | 118 | €7,141/ha | €7,504/ha | 16.61 ha |
| 2021 | 230 | €7,025/ha | €6,998/ha | 15.32 ha |
| 2022 | 272 | €7,149/ha | €7,000/ha | 11.82 ha |
| 2023 | 262 | €7,327/ha | €7,387/ha | 14.00 ha |
| 2024 | 219 | €7,074/ha | €6,919/ha | 14.26 ha |
| 2025 | 248 | €6,763/ha | €6,897/ha | 12.64 ha |
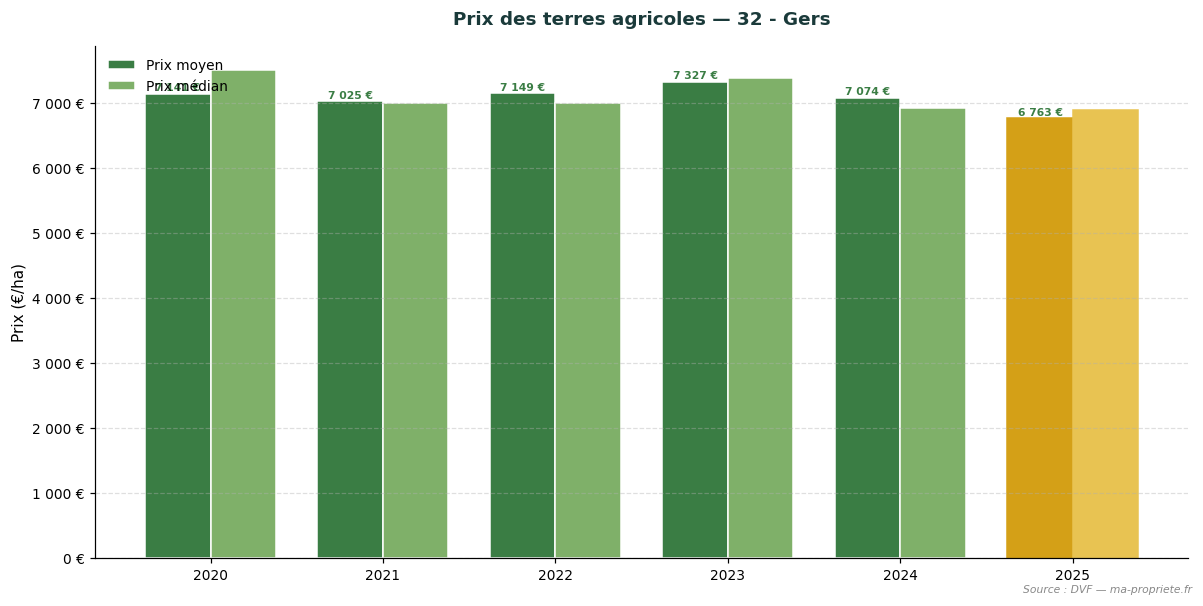
Trend in agricultural land prices — 32 - Gers. Source: DVF, processed by ma-propriete.fr. The year 2025 is highlighted in gold.
Hérault (excluding viticulture) combines fruit growing, market gardening and PGI-labelled productions. In 2025, the average price of agricultural land in the department stands at €11,191/ha (-36.7% compared to 2024). The median price reaches €10,000/ha, based on 29 recorded transactions (average area 6.21 ha). The low number of transactions (fewer than 30 sales) calls for caution when interpreting annual averages.
| Year | No. of sales | Average price | Median price | Avg. area |
|---|---|---|---|---|
| 2020 | 18 | €9,679/ha | €9,034/ha | 6.92 ha |
| 2021 | 39 | €10,913/ha | €9,831/ha | 8.82 ha |
| 2022 | 25 | €9,250/ha | €9,000/ha | 5.53 ha |
| 2023 | 23 | €11,048/ha | €9,662/ha | 7.08 ha |
| 2024 | 34 | €17,684/ha | €20,000/ha | 6.36 ha |
| 2025 | 29 | €11,191/ha | €10,000/ha | 6.21 ha |
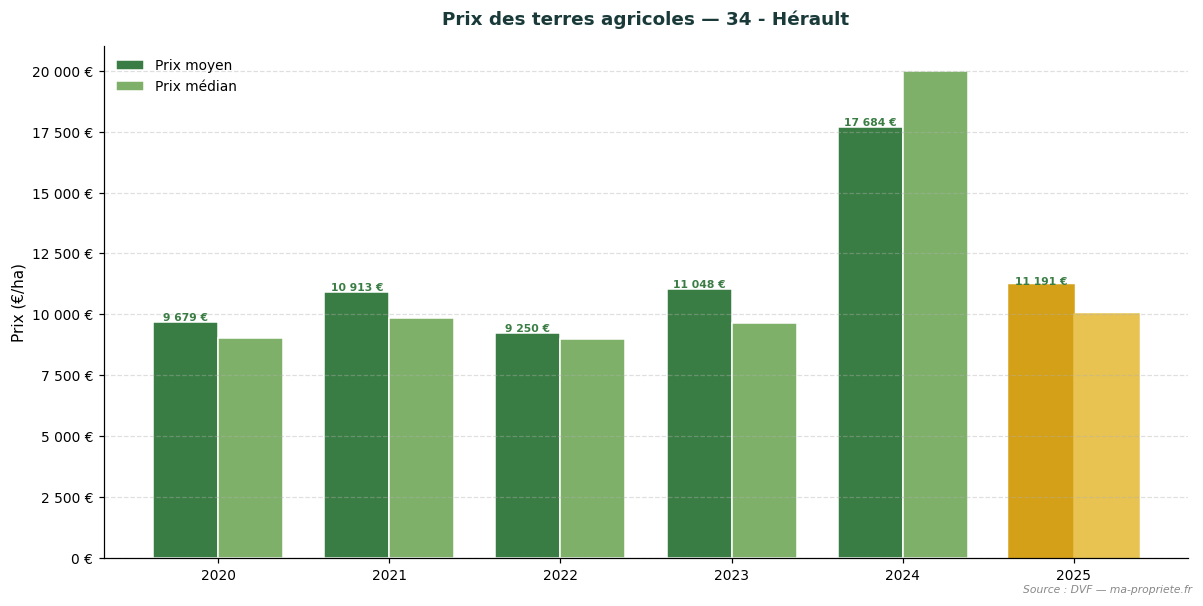
Trend in agricultural land prices — 34 - Hérault. Source: DVF, processed by ma-propriete.fr. The year 2025 is highlighted in gold.
Lot combines mixed crop-livestock farming, fruit growing and labelled productions (truffle, lamb). In 2025, the average price of agricultural land in the department stands at €6,345/ha (+22.9% compared to 2024). The median price reaches €5,500/ha, based on 43 recorded transactions (average area 7.19 ha).
| Year | No. of sales | Average price | Median price | Avg. area |
|---|---|---|---|---|
| 2020 | 19 | €5,837/ha | €5,239/ha | 6.42 ha |
| 2021 | 37 | €5,632/ha | €4,810/ha | 7.57 ha |
| 2022 | 33 | €5,769/ha | €5,505/ha | 5.07 ha |
| 2023 | 36 | €5,816/ha | €5,387/ha | 6.03 ha |
| 2024 | 42 | €5,163/ha | €5,199/ha | 8.66 ha |
| 2025 | 43 | €6,345/ha | €5,500/ha | 7.19 ha |
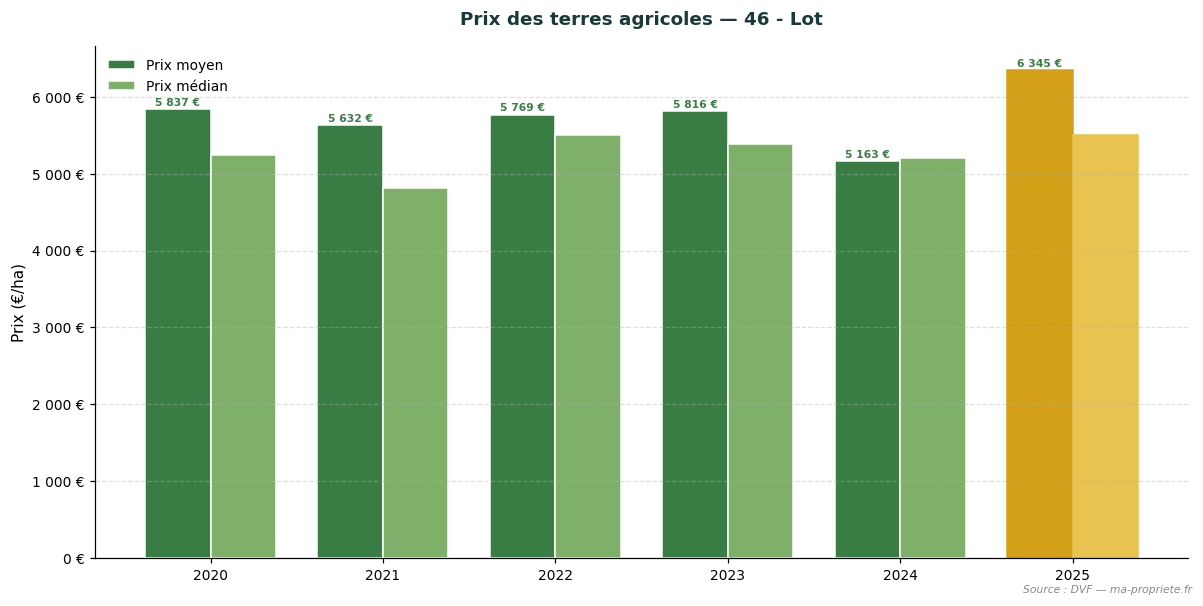
Trend in agricultural land prices — 46 - Lot. Source: DVF, processed by ma-propriete.fr. The year 2025 is highlighted in gold.
Lozère, predominantly extensive livestock farming on the Causses plateaus, has the most accessible prices in the region. In 2025, the average price of agricultural land in the department stands at €3,523/ha (+1.8% compared to 2024). The median price reaches €3,079/ha, based on 18 recorded transactions (average area 7.42 ha). The low number of transactions (fewer than 30 sales) calls for caution when interpreting annual averages.
| Year | No. of sales | Average price | Median price | Avg. area |
|---|---|---|---|---|
| 2020 | 14 | €4,489/ha | €3,910/ha | 6.99 ha |
| 2021 | 10 | €2,774/ha | €2,281/ha | 8.19 ha |
| 2022 | 11 | €4,765/ha | €3,673/ha | 16.23 ha |
| 2023 | 18 | €5,306/ha | €5,062/ha | 13.83 ha |
| 2024 | 21 | €3,462/ha | €3,054/ha | 8.95 ha |
| 2025 | 18 | €3,523/ha | €3,079/ha | 7.42 ha |
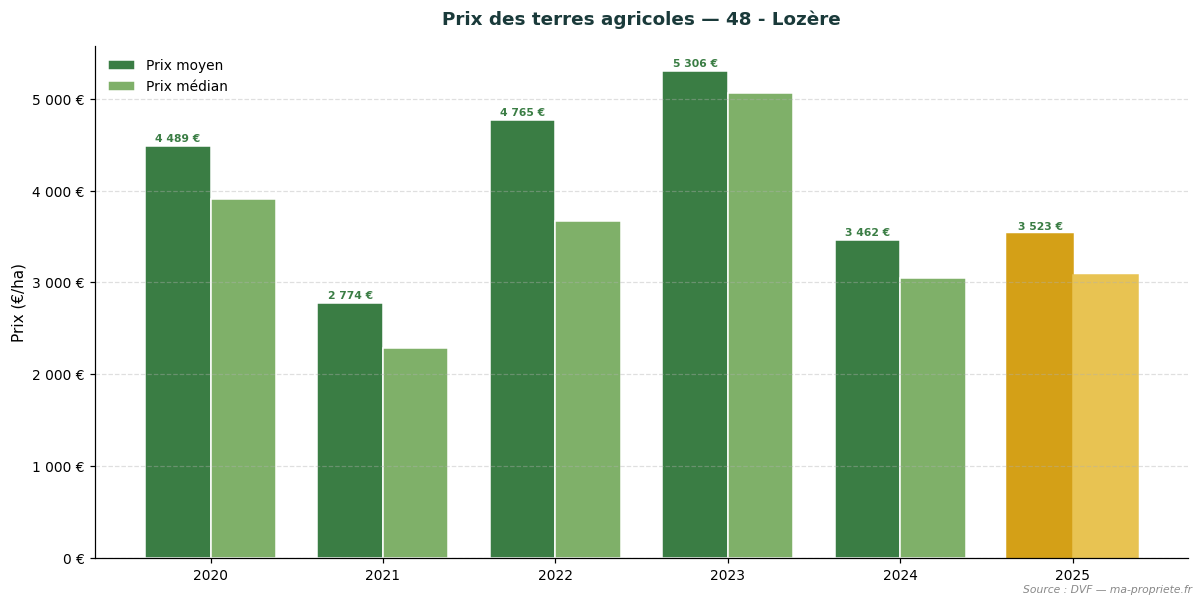
Trend in agricultural land prices — 48 - Lozère. Source: DVF, processed by ma-propriete.fr. The year 2025 is highlighted in gold.
Hautes-Pyrénées combines mountain livestock farming and arable crops in the foothills. In 2025, the average price of agricultural land in the department stands at €7,982/ha (-1.0% compared to 2024). The median price reaches €8,219/ha, based on 61 recorded transactions (average area 6.04 ha).
| Year | No. of sales | Average price | Median price | Avg. area |
|---|---|---|---|---|
| 2020 | 18 | €8,364/ha | €8,339/ha | 9.77 ha |
| 2021 | 66 | €7,861/ha | €7,541/ha | 6.47 ha |
| 2022 | 70 | €7,903/ha | €8,000/ha | 7.34 ha |
| 2023 | 65 | €8,774/ha | €8,500/ha | 6.66 ha |
| 2024 | 57 | €8,062/ha | €8,004/ha | 7.09 ha |
| 2025 | 61 | €7,982/ha | €8,219/ha | 6.04 ha |
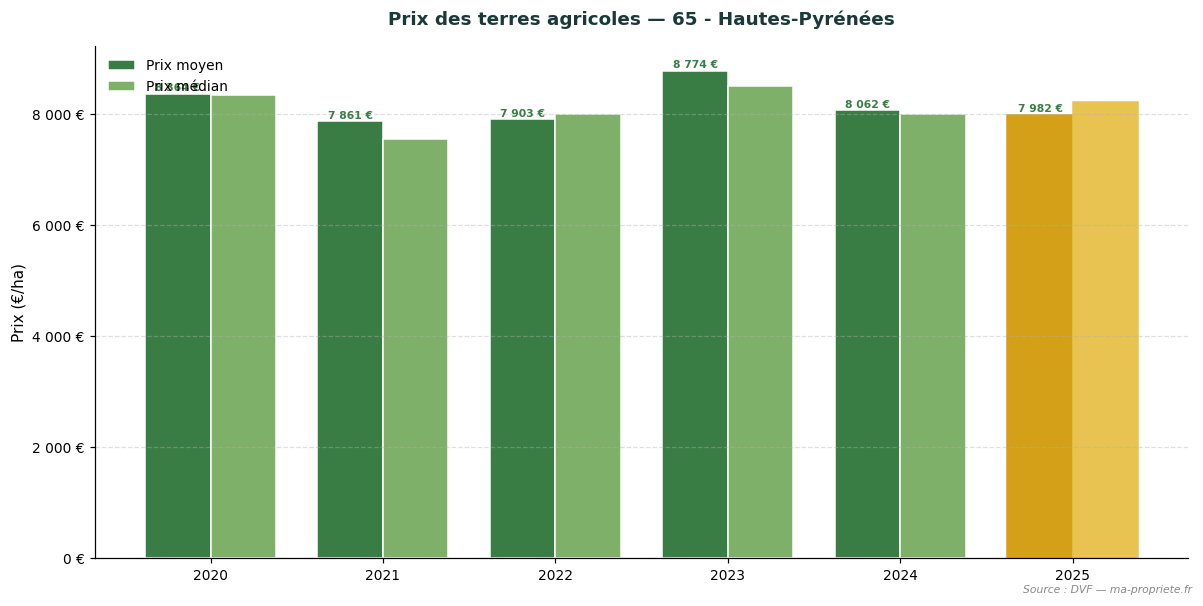
Trend in agricultural land prices — 65 - Hautes-Pyrénées. Source: DVF, processed by ma-propriete.fr. The year 2025 is highlighted in gold.
Pyrénées-Orientales (excluding viticulture) encompasses market gardening, fruit growing and Mediterranean productions. In 2025, the average price of agricultural land in the department stands at €15,995/ha (+15.0% compared to 2024). The median price reaches €13,501/ha, based on 12 recorded transactions (average area 4.56 ha). The low number of transactions (fewer than 30 sales) calls for caution when interpreting annual averages.
| Year | No. of sales | Average price | Median price | Avg. area |
|---|---|---|---|---|
| 2020 | 7 | €16,861/ha | €18,793/ha | 4.59 ha |
| 2021 | 14 | €9,732/ha | €9,901/ha | 5.84 ha |
| 2022 | 8 | €11,238/ha | €11,185/ha | 4.76 ha |
| 2023 | 16 | €10,131/ha | €8,989/ha | 6.01 ha |
| 2024 | 10 | €13,912/ha | €12,568/ha | 9.28 ha |
| 2025 | 12 | €15,995/ha | €13,501/ha | 4.56 ha |
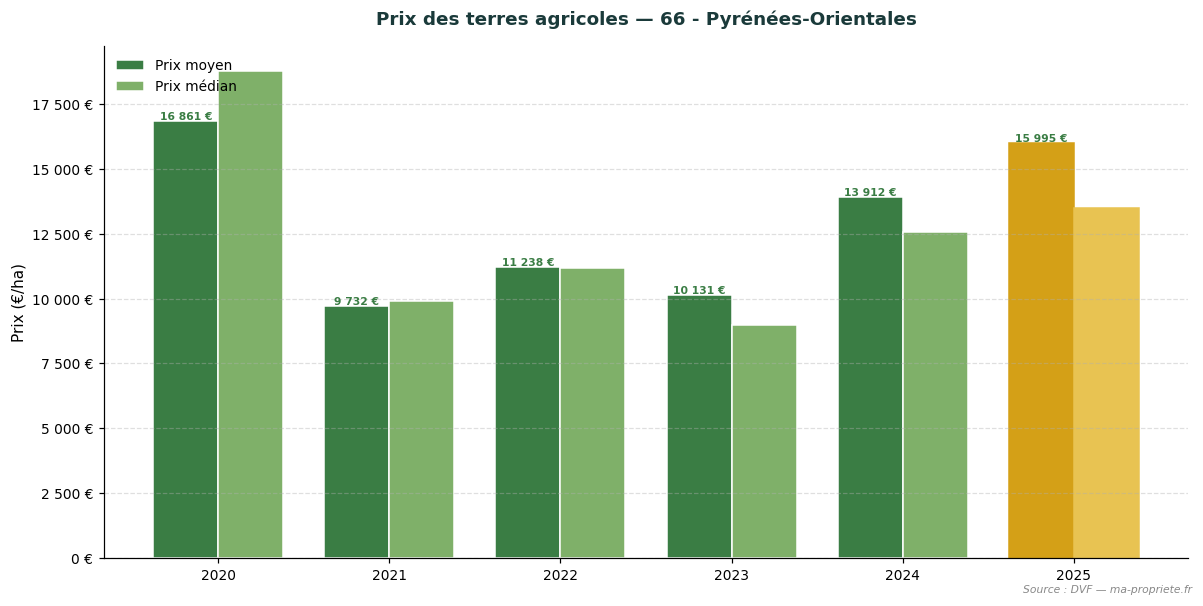
Trend in agricultural land prices — 66 - Pyrénées-Orientales. Source: DVF, processed by ma-propriete.fr. The year 2025 is highlighted in gold.
Tarn combines arable crops, livestock farming and labelled productions. In 2025, the average price of agricultural land in the department stands at €6,408/ha (-17.5% compared to 2024). The median price reaches €6,000/ha, based on 86 recorded transactions (average area 10.70 ha).
| Year | No. of sales | Average price | Median price | Avg. area |
|---|---|---|---|---|
| 2020 | 52 | €6,741/ha | €6,250/ha | 8.73 ha |
| 2021 | 110 | €6,494/ha | €5,986/ha | 9.54 ha |
| 2022 | 126 | €6,091/ha | €5,784/ha | 9.57 ha |
| 2023 | 112 | €6,813/ha | €6,640/ha | 12.78 ha |
| 2024 | 133 | €7,769/ha | €7,321/ha | 10.49 ha |
| 2025 | 86 | €6,408/ha | €6,000/ha | 10.70 ha |
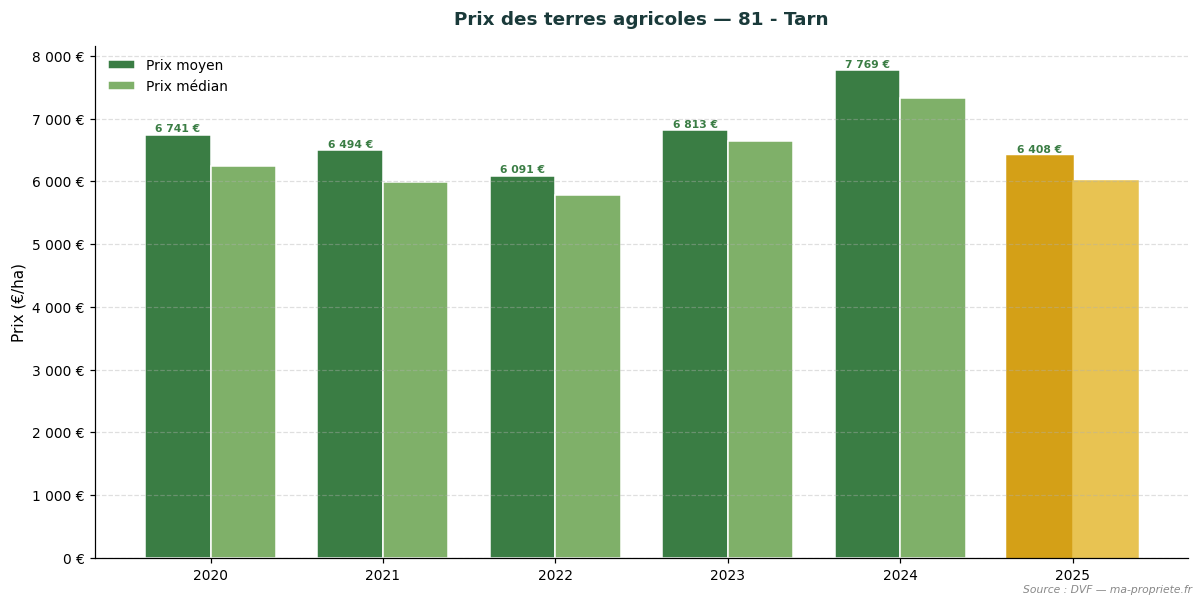
Trend in agricultural land prices — 81 - Tarn. Source: DVF, processed by ma-propriete.fr. The year 2025 is highlighted in gold.
Tarn-et-Garonne, predominantly fruit-growing and market gardening, displays an active land market. In 2025, the average price of agricultural land in the department stands at €7,959/ha (-3.8% compared to 2024). The median price reaches €7,301/ha, based on 113 recorded transactions (average area 11.56 ha).
| Year | No. of sales | Average price | Median price | Avg. area |
|---|---|---|---|---|
| 2020 | 44 | €6,504/ha | €5,640/ha | 9.13 ha |
| 2021 | 101 | €7,126/ha | €7,000/ha | 11.38 ha |
| 2022 | 141 | €7,709/ha | €7,228/ha | 8.98 ha |
| 2023 | 116 | €7,614/ha | €7,355/ha | 10.83 ha |
| 2024 | 93 | €8,276/ha | €7,375/ha | 9.88 ha |
| 2025 | 113 | €7,959/ha | €7,301/ha | 11.56 ha |
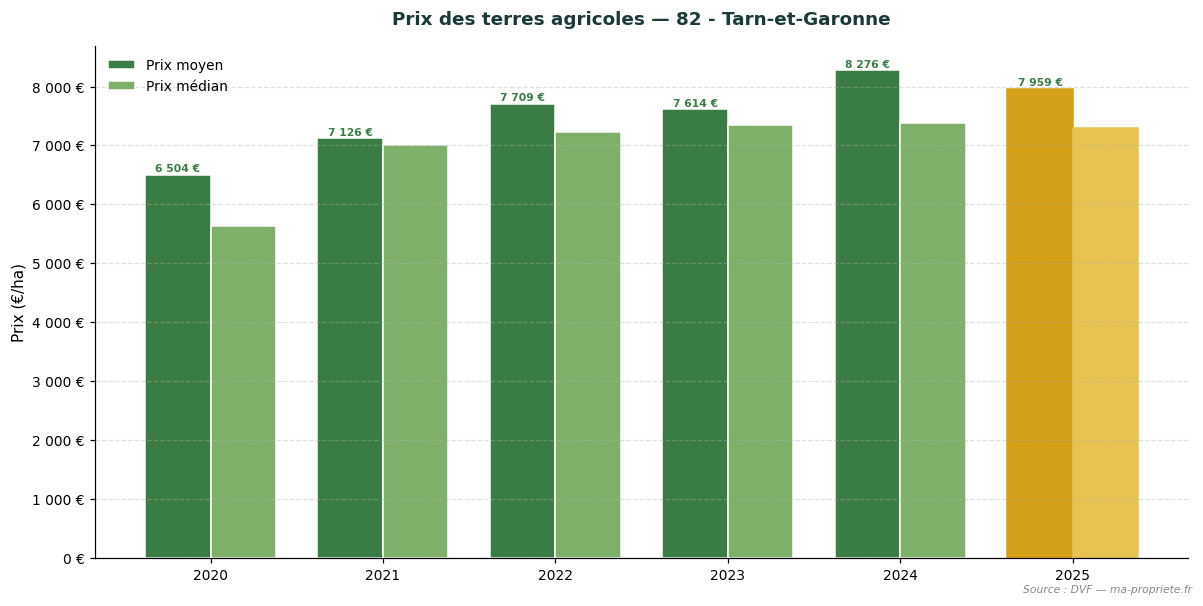
Trend in agricultural land prices — 82 - Tarn-et-Garonne. Source: DVF, processed by ma-propriete.fr. The year 2025 is highlighted in gold.
The statistics presented in this article are based on the DVF (Demandes de Valeurs Foncières) database, made available by the Directorate General of Public Finances. This database records all property transfers registered in metropolitan France and overseas departments. We applied rigorous filtering to retain only transactions corresponding to strictly agricultural parcels (arable land, grasslands, specialised crops excluding vineyards), systematically excluding built properties, vineyards and AOC wine estates, as well as mixed sales combining parcels and buildings.
For each retained transaction, we calculate the price per hectare by dividing the declared land value by the area of the transferred property. The regional and departmental statistics then aggregate these unit values: average price, median price, first decile (P10) and ninth decile (P90), average area, and total number of annual sales.
The use of DVF data requires several methodological precautions.
The statistics published annually by the SAFERs (Sociétés d'aménagement foncier et d'établissement rural) and the Ministry of Agriculture differ from our DVF approach on several points. The SAFERs rely on transactions subject to their pre-emption rights or intermediation, which covers only part of the market. They also explicitly distinguish between sales of vacant land (not occupied by a tenant farmer) and sales of tenanted land (already under a rural lease), with a structural discount of approximately 18% for the latter.
The DVF approach, being more comprehensive, incorporates all registered transfers without distinguishing tenancy status. This explains why average DVF levels may differ from SAFER publications, particularly in regions where the proportion of tenanted sales is significant. We present both series in parallel to provide the most complete possible picture of the agricultural land market.
The year 2025 confirms the stability of the agricultural land market in Occitanie as a whole, with a regional average price of €7,653/ha (-5.2% vs 2024). Behind this average, the region's 13 departments display differentiated dynamics that reflect the diversity of terroirs and production orientations. The coastal departments (Gard, Hérault, Pyrénées-Orientales) show prices driven upward by land pressure and diversification, while the rural departments (Lozère, Aveyron, Lot) remain at considerably more moderate levels.
To regularly monitor trends in the agricultural land market, consult the agricultural land price observatory on ma-propriete.fr, as well as the agricultural section and the agricultural listings published on our portal.
To deepen your analysis of the French agricultural land market, find our articles dedicated to each region.