Updated on May 7, 2026: We have built an Observatory of Land Prices in France based on DVF data published by the tax authorities. Discover land sale prices in the Brittany region from July 1, 2020 to December 31, 2025.
Summary of the main DVF statistics for 2025, now available in full. The figures below relate exclusively to agricultural land excluding vineyards (field crops, pastures, arable land, specialized crops).
| Key Figures 2025 — Brittany | |
|---|---|
| Average price | €5,803/ha |
| Median price | €5,500/ha |
| First decile (P10) | €3,510/ha |
| Ninth decile (P90) | €8,658/ha |
| Number of sales | 1,297 |
| Average area | 10.02 ha |
| Change vs 2024 | -0.3% |
Brittany remains France's leading livestock region, structured around dairy, pig and poultry production, with strong integration into regional agri-food sectors. Brittany's UAA (Utilized Agricultural Area) represents approximately 1.6 million hectares. The main regional agricultural orientations — intensive dairy farming, intensive pig and poultry farming, large-scale forage crops (corn, wheat), open-field vegetables (cauliflower, artichokes) in the northern belt — structure a land market whose levels and dynamics differ significantly from one department to another.
This article presents agricultural land prices in Brittany based on DVF data (Demandes de Valeurs Foncières) processed by ma-propriete.fr, supplemented by publications from the Ministry of Agriculture from SAFER. The year 2025, now available in full, is commented on as a priority; the year 2024 serves as a comparative reference.
In 2025, the average price of agricultural land in Brittany stands at €5,803/ha, representing a change of -0.3% compared to 2024. The median price, an indicator less sensitive to extreme transactions, reaches €5,500/ha. Over the year as a whole, 1,297 transactions were recorded in the region, with an average area per sale of 10.02 ha.
The gap between the first decile (€3,510/ha) and the ninth decile (€8,658/ha) — a P90/P10 ratio of 2.5 — illustrates the dispersion of prices within the region. This dispersion reflects the heterogeneity of soils, the diversity of productive orientations and the variability of land pressure depending on the area.
Over the 2021-2025 period (the first years fully covered by DVF), the regional average price is rising (+4.3%).
| Year | Number of sales | Average price | Median price | P10 | P90 | Average area |
|---|---|---|---|---|---|---|
| 2020 | 737 | €5,598/ha | €5,195/ha | €3,358/ha | €8,221/ha | 9.60 ha |
| 2021 | 1,417 | €5,563/ha | €5,099/ha | €3,253/ha | €8,297/ha | 9.98 ha |
| 2022 | 1,535 | €5,601/ha | €5,191/ha | €3,325/ha | €8,500/ha | 10.19 ha |
| 2023 | 1,409 | €5,654/ha | €5,355/ha | €3,500/ha | €8,301/ha | 10.34 ha |
| 2024 | 1,389 | €5,818/ha | €5,500/ha | €3,491/ha | €8,811/ha | 10.15 ha |
| 2025 | 1,297 | €5,803/ha | €5,500/ha | €3,510/ha | €8,658/ha | 10.02 ha |
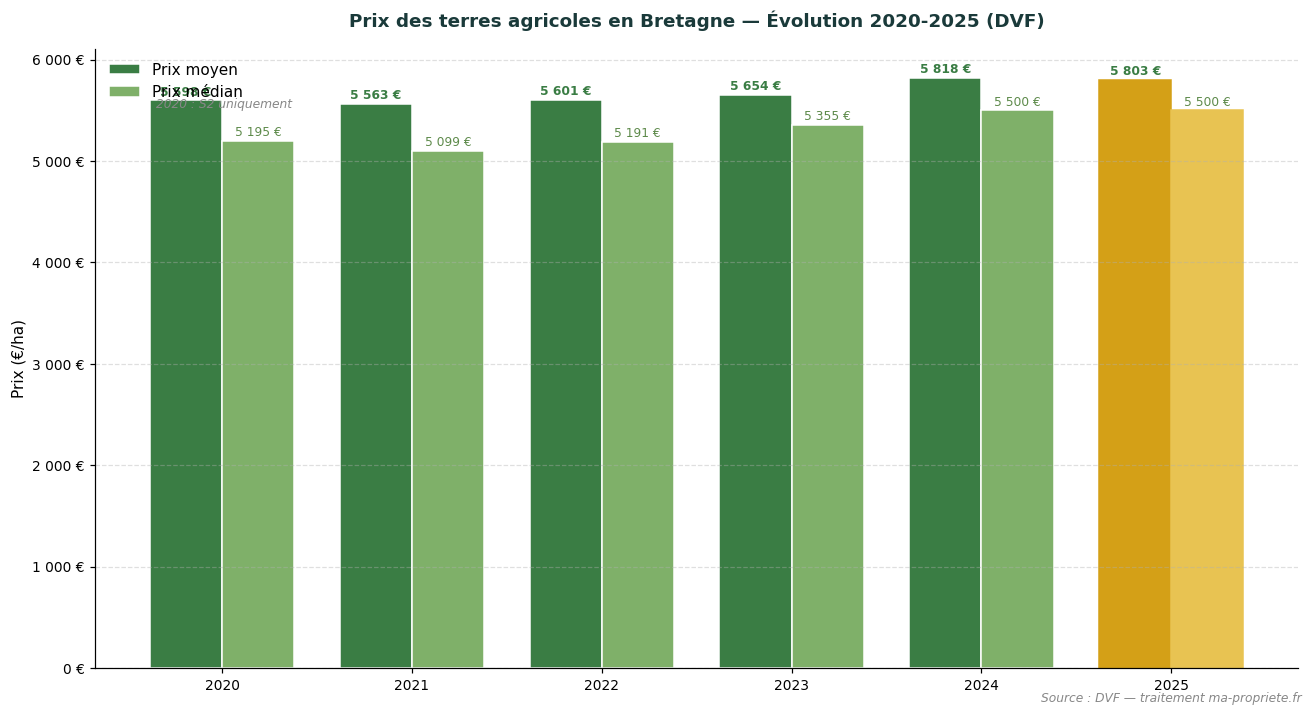
Evolution of average and median agricultural land prices in Brittany (2020-2025). Source: DVF, processed by ma-propriete.fr. The year 2025 is highlighted in gold.
The SAFER publishes an annual summary of agricultural land prices each year, distinguishing between sales of vacant land (plots not occupied by a tenant farmer) and sales of rented land (plots already under a rural lease). In Brittany, the latest year available is 2024: the average price of vacant land reaches €6,520/ha, compared with €5,170/ha for rented land. In 2024, the gap between vacant land and rented land reaches 21% in Brittany, in line with the national average (~18%).
| Year | Vacant land (SAFER) | Rented land (SAFER) |
|---|---|---|
| 2015 | €5,600/ha | €4,420/ha |
| 2018 | €5,790/ha | €4,590/ha |
| 2020 | €5,960/ha | €4,830/ha |
| 2022 | €5,960/ha | €4,920/ha |
| 2023 | €6,160/ha | €5,130/ha |
| 2024 | €6,520/ha | €5,170/ha |
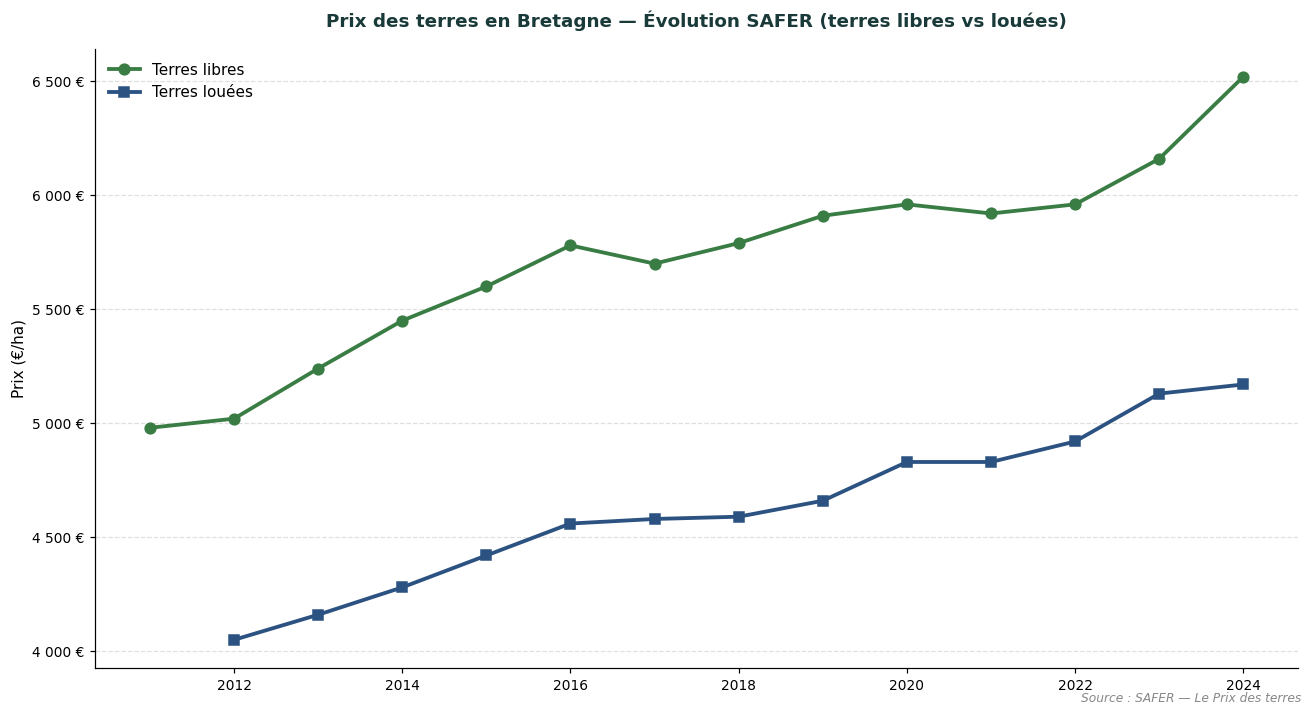
Comparative evolution of vacant and rented land prices in Brittany. Source: SAFER — Land Prices.
SAFER levels cannot be directly superimposed on the DVF levels presented above: SAFER only covers part of the market (transactions subject to pre-emption rights or intermediation), while DVF reports all recorded transactions. The two sources are complementary and make it possible to objectively assess the land market from two distinct angles.
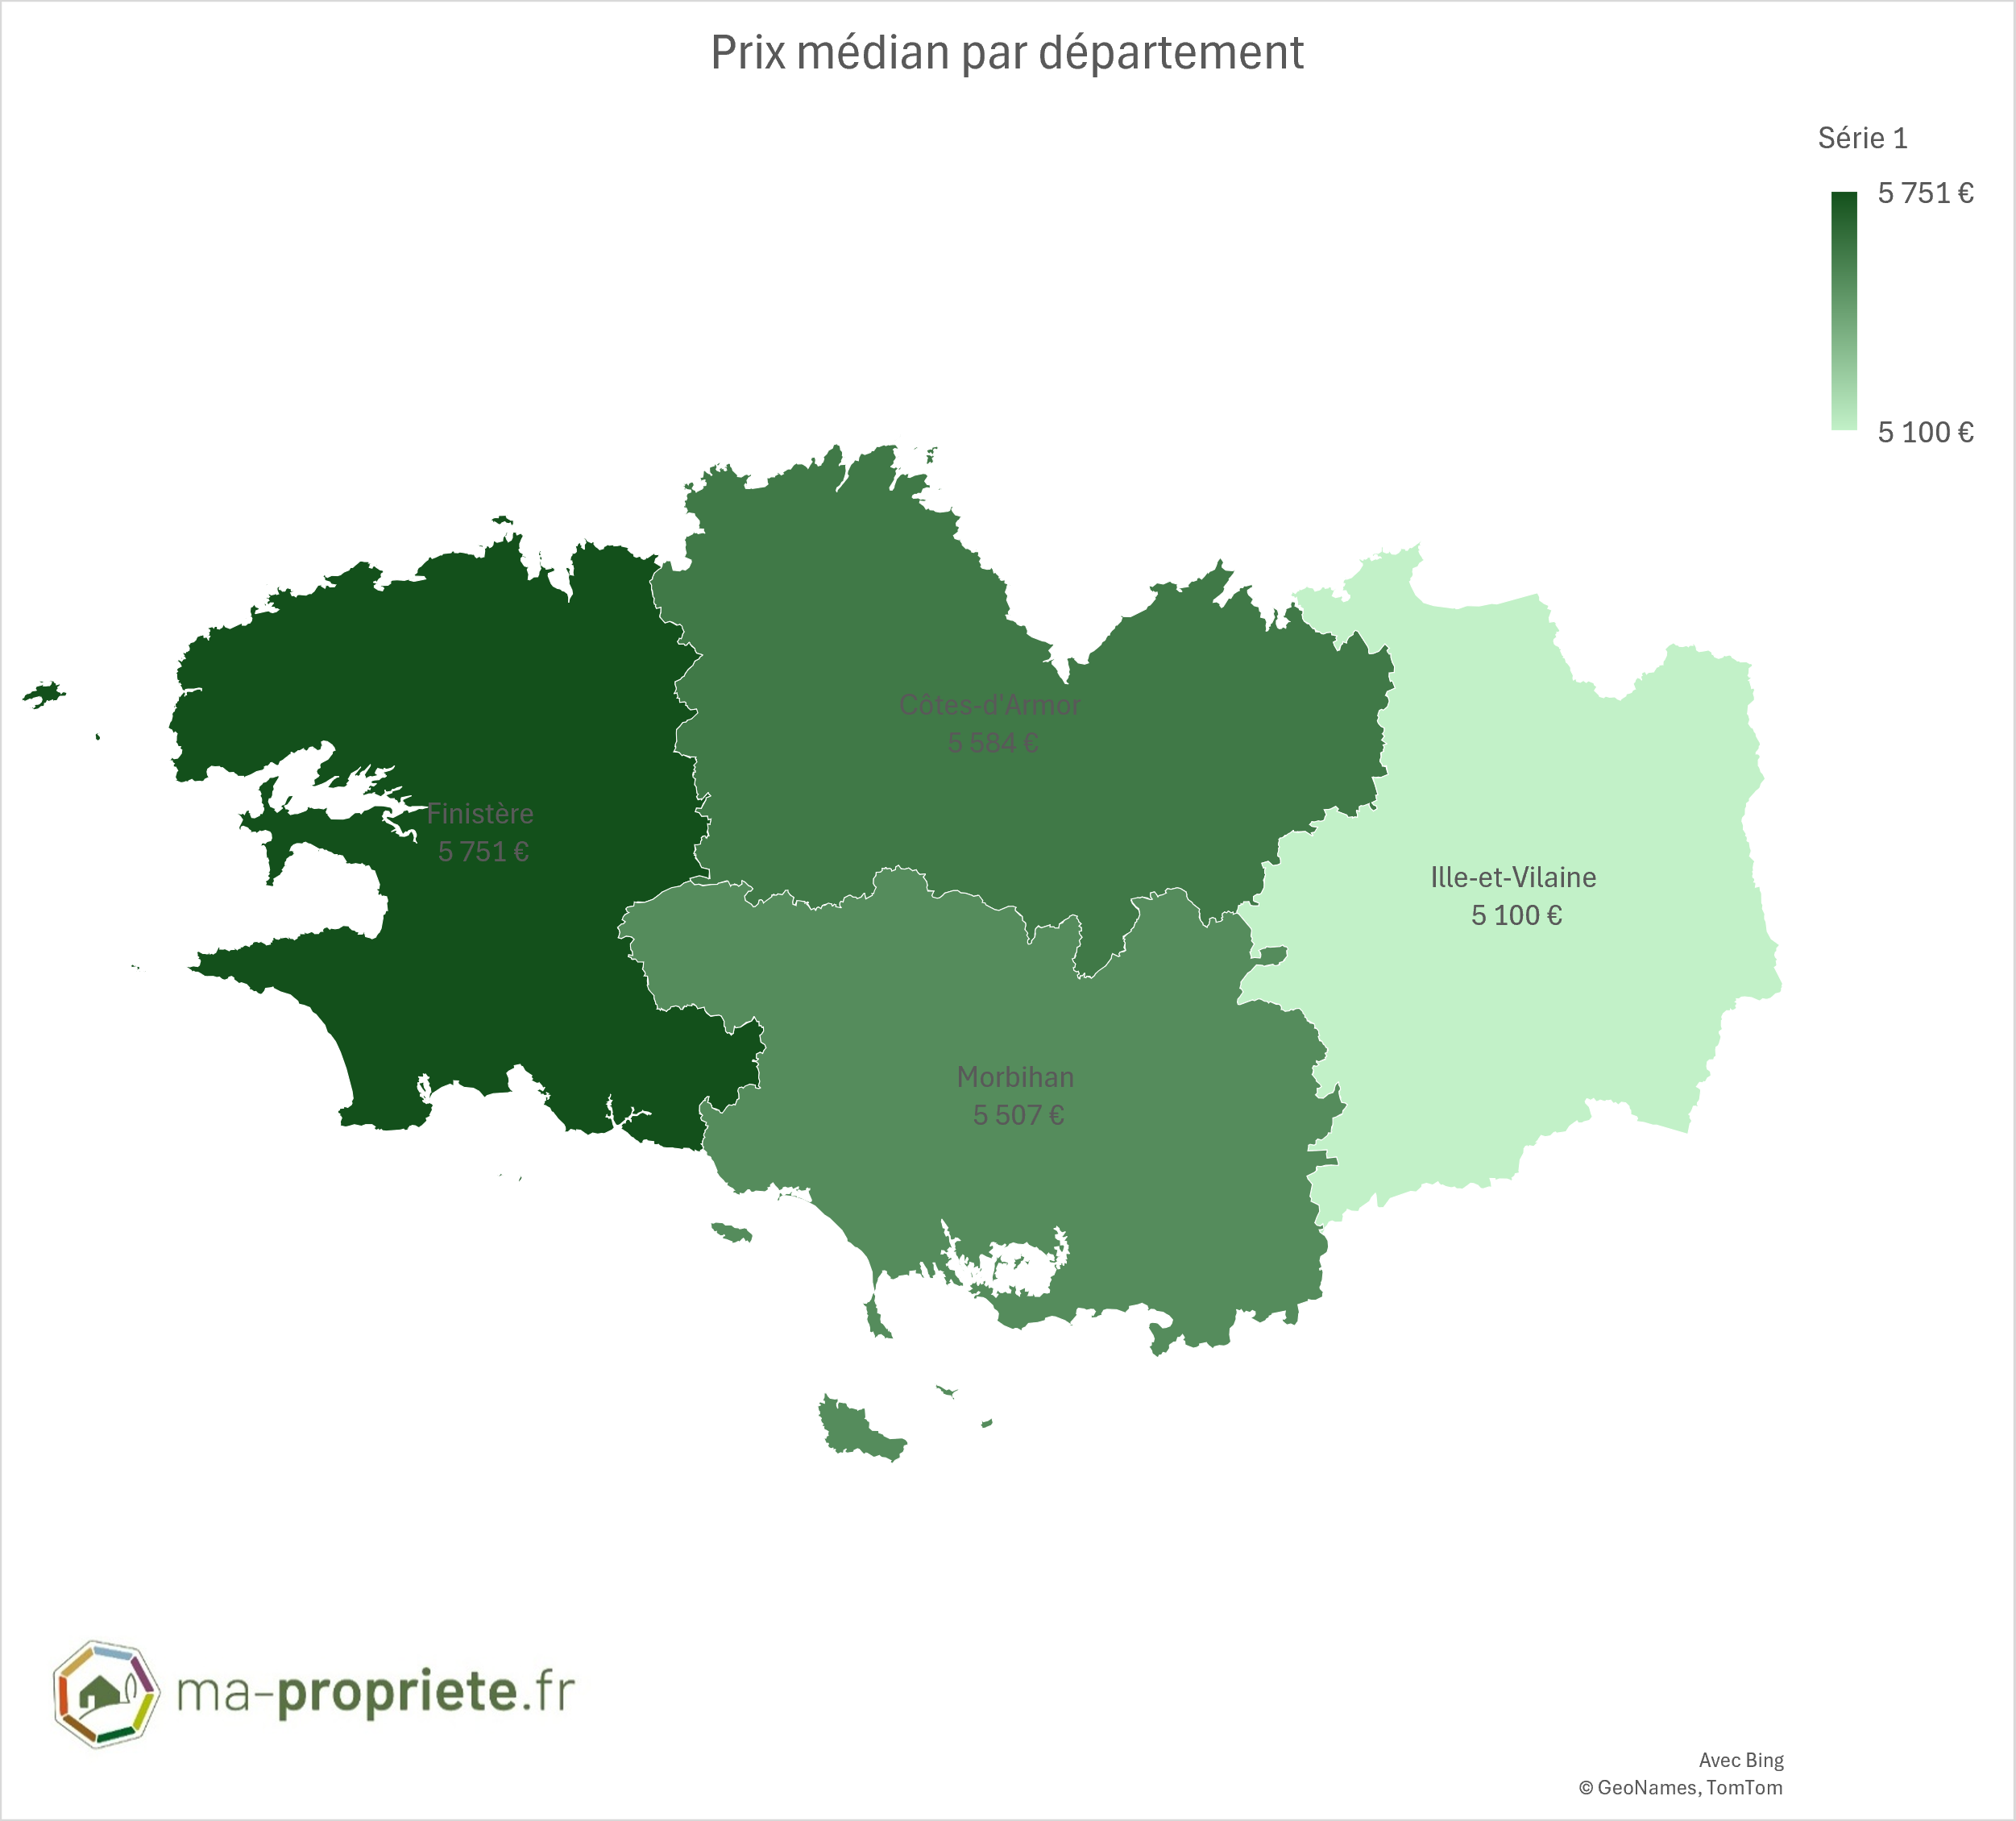
Côtes-d'Armor concentrates dairy, pig and open-field vegetable production. In 2025, the average price of agricultural land in the department stands at €5,872/ha (-0.8% compared to 2024). The median price reaches €5,584/ha, based on 371 recorded transactions (average area 10.33 ha).
| Year | Number of sales | Average price | Median price | Avg. area |
|---|---|---|---|---|
| 2020 | 199 | €5,536/ha | €5,195/ha | 9.52 ha |
| 2021 | 406 | €5,739/ha | €5,303/ha | 9.72 ha |
| 2022 | 482 | €5,673/ha | €5,435/ha | 10.54 ha |
| 2023 | 410 | €5,690/ha | €5,406/ha | 10.10 ha |
| 2024 | 404 | €5,921/ha | €5,539/ha | 10.34 ha |
| 2025 | 371 | €5,872/ha | €5,584/ha | 10.33 ha |
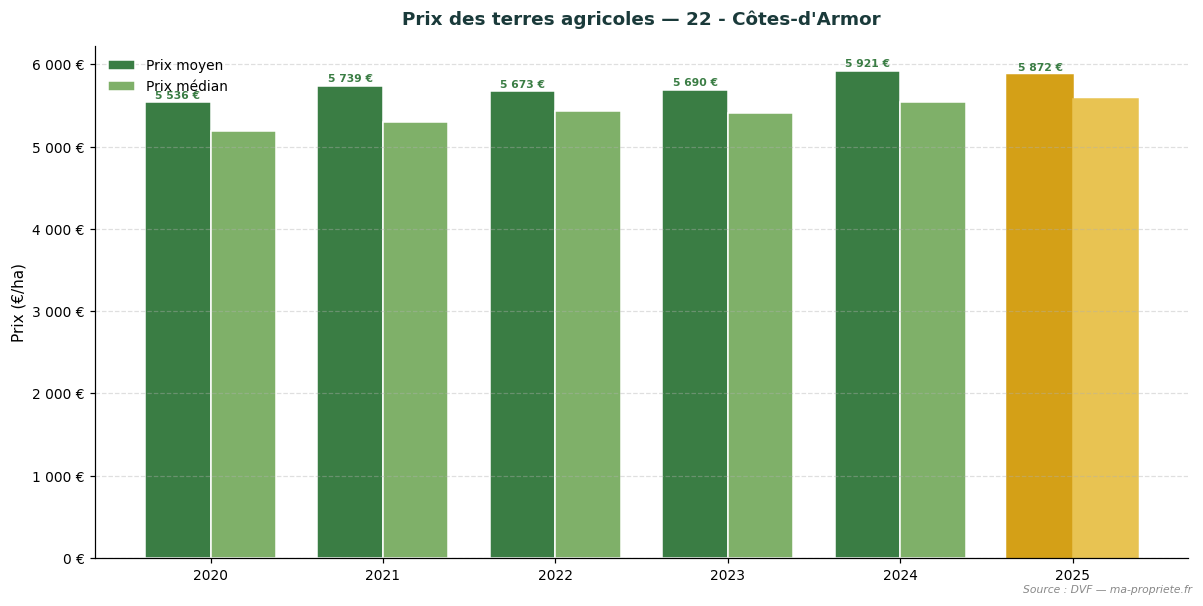
Evolution of agricultural land prices — 22 - Côtes-d'Armor. Source: DVF, processed by ma-propriete.fr. The year 2025 is highlighted in gold.
Finistère combines intensive dairy farming, open-field vegetables and an intensive livestock hub. In 2025, the average price of agricultural land in the department stands at €6,059/ha (-2.0% compared to 2024). The median price reaches €5,751/ha, based on 276 recorded transactions (average area 9.45 ha).
| Year | Number of sales | Average price | Median price | Avg. area |
|---|---|---|---|---|
| 2020 | 170 | €5,728/ha | €5,216/ha | 9.78 ha |
| 2021 | 303 | €5,902/ha | €5,360/ha | 10.55 ha |
| 2022 | 351 | €5,827/ha | €5,220/ha | 10.26 ha |
| 2023 | 343 | €5,784/ha | €5,496/ha | 10.46 ha |
| 2024 | 310 | €6,182/ha | €5,517/ha | 9.82 ha |
| 2025 | 276 | €6,059/ha | €5,751/ha | 9.45 ha |
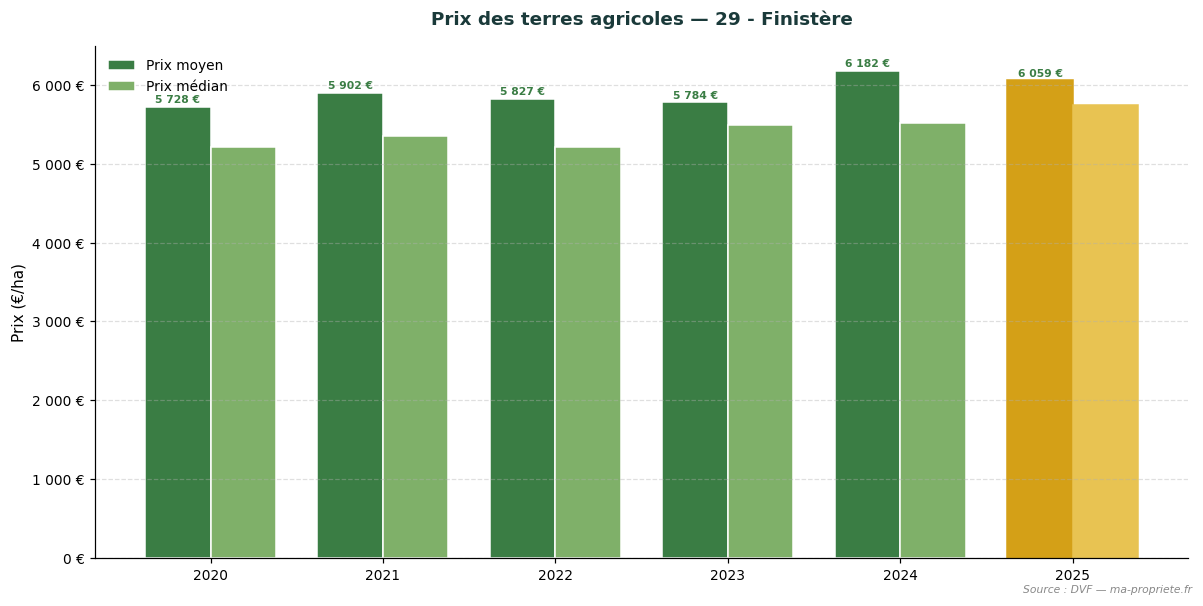
Evolution of agricultural land prices — 29 - Finistère. Source: DVF, processed by ma-propriete.fr. The year 2025 is highlighted in gold.
Ille-et-Vilaine, France's leading dairy department, has the most active land market in the region. In 2025, the average price of agricultural land in the department stands at €5,387/ha (-1.2% compared to 2024). The median price reaches €5,100/ha, based on 357 recorded transactions (average area 8.42 ha).
| Year | Number of sales | Average price | Median price | Avg. area |
|---|---|---|---|---|
| 2020 | 211 | €5,430/ha | €5,015/ha | 9.03 ha |
| 2021 | 406 | €5,373/ha | €5,016/ha | 8.63 ha |
| 2022 | 414 | €5,429/ha | €5,038/ha | 8.88 ha |
| 2023 | 375 | €5,527/ha | €5,500/ha | 9.35 ha |
| 2024 | 379 | €5,450/ha | €5,300/ha | 9.19 ha |
| 2025 | 357 | €5,387/ha | €5,100/ha | 8.42 ha |
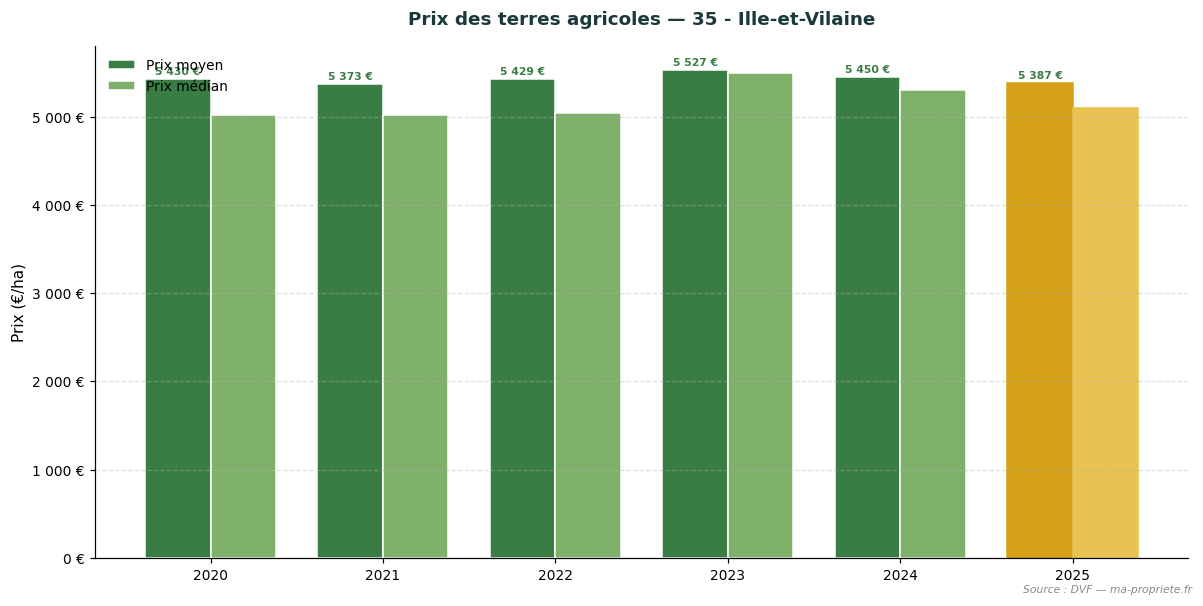
Evolution of agricultural land prices — 35 - Ille-et-Vilaine. Source: DVF, processed by ma-propriete.fr. The year 2025 is highlighted in gold.
Morbihan combines dairy farming, intensive livestock and large-scale crops, with strong consolidation dynamics. In 2025, the average price of agricultural land in the department stands at €5,980/ha (+3.7% compared to 2024). The median price reaches €5,507/ha, based on 293 recorded transactions (average area 12.12 ha).
| Year | Number of sales | Average price | Median price | Avg. area |
|---|---|---|---|---|
| 2020 | 157 | €5,761/ha | €5,274/ha | 10.25 ha |
| 2021 | 302 | €5,243/ha | €4,833/ha | 11.56 ha |
| 2022 | 288 | €5,454/ha | €4,962/ha | 11.41 ha |
| 2023 | 281 | €5,611/ha | €5,000/ha | 11.86 ha |
| 2024 | 296 | €5,767/ha | €5,249/ha | 11.45 ha |
| 2025 | 293 | €5,980/ha | €5,507/ha | 12.12 ha |
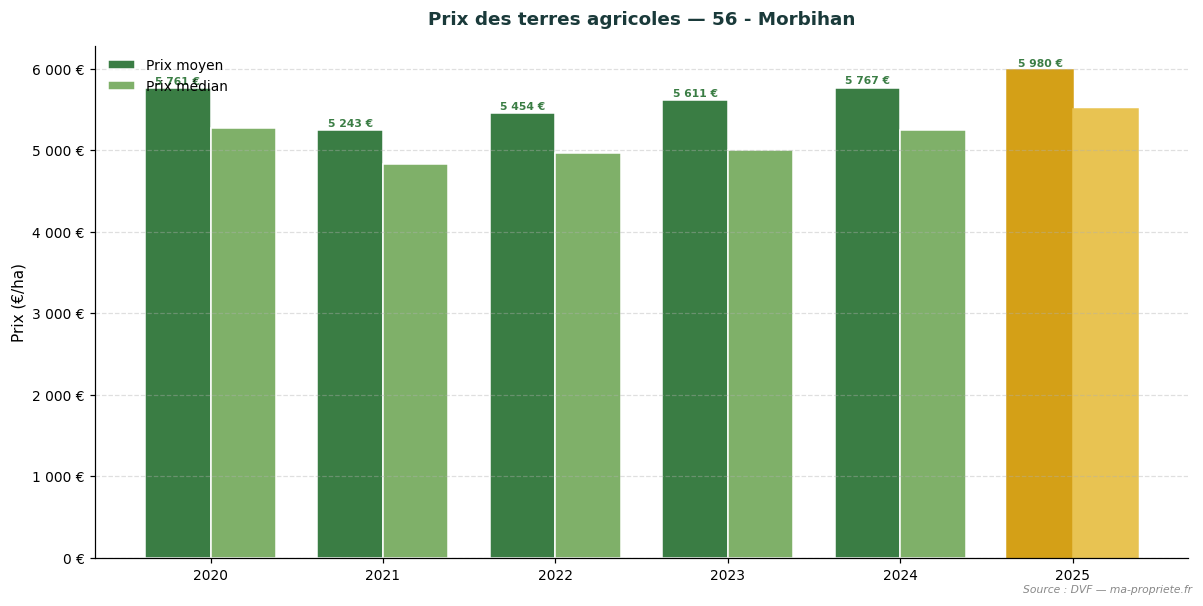
Evolution of agricultural land prices — 56 - Morbihan. Source: DVF, processed by ma-propriete.fr. The year 2025 is highlighted in gold.
The statistics presented in this article are based on the DVF (Demandes de Valeurs Foncières) database, made available by the French General Directorate of Public Finances. This database lists all real estate transactions recorded in mainland France and the overseas departments. We applied rigorous filtering to retain only transactions corresponding to strictly agricultural parcels (arable land, pastures, specialized crops excluding vineyards), systematically excluding built properties, vineyards and AOC vineyards, as well as mixed sales combining parcels and buildings.
For each transaction retained, we calculate the price per hectare by relating the declared land value to the area of the property transferred. The regional and departmental statistics then aggregate these unit values: average price, median price, first decile (P10) and ninth decile (P90), average area, as well as the total number of annual sales.
The use of DVF data calls for several methodological precautions.
The statistics published annually by SAFER (Sociétés d'aménagement foncier et d'établissement rural — Rural Land Development Agencies) and the Ministry of Agriculture differ from our DVF approach on several points. The SAFER relies on transactions subject to its right of pre-emption or to its intermediation, which only covers part of the market. It also explicitly distinguishes between sales of vacant land (not occupied by a tenant farmer) and sales of rented land (already under a rural lease), with a structural gap of approximately 18% discount for the latter.
The DVF approach, more comprehensive, includes all recorded transactions without distinction of rental status. This explains why the average DVF levels may differ from SAFER publications, particularly in regions where the weight of rented land sales is significant. We present both series in parallel to offer the most complete possible view of the agricultural land market.
The year 2025 confirms the stability of the agricultural land market in Brittany as a whole, with a regional average price of €5,803/ha (-0.3% vs 2024). Behind this average, the 4 departments of the region show differentiated dynamics that reflect the diversity of soils and productive orientations. The Brittany market is distinguished by strong regional homogeneity: the four departments display similar average prices, structured by the consolidation dynamics of dairy farms and competition from intensive livestock production.
To regularly track the evolution of the agricultural land market, visit the agricultural land price observatory of ma-propriete.fr, as well as the agricultural section and the agricultural listings published on our portal.
To further explore the analysis of the French agricultural land market, find our articles dedicated to each region.