Updated on May 7, 2026: Find the most recent data on our Land Price Observatory (DVF data 2020-2025) which presents average prices, medians and transaction ranges for your region and each department.
Summary of the main DVF statistics for 2025, now fully available. The figures below relate exclusively to agricultural land excluding vineyards (field crops, grasslands, arable land, specialized crops).
| 2025 key figures — Auvergne-Rhône-Alpes | |
|---|---|
| Average price | €4,786/ha |
| Median price | €3,887/ha |
| First decile (P10) | €2,161/ha |
| Ninth decile (P90) | €8,738/ha |
| Number of sales | 1,230 |
| Average area | 9.71 ha |
| Change vs 2024 | +4.0% |
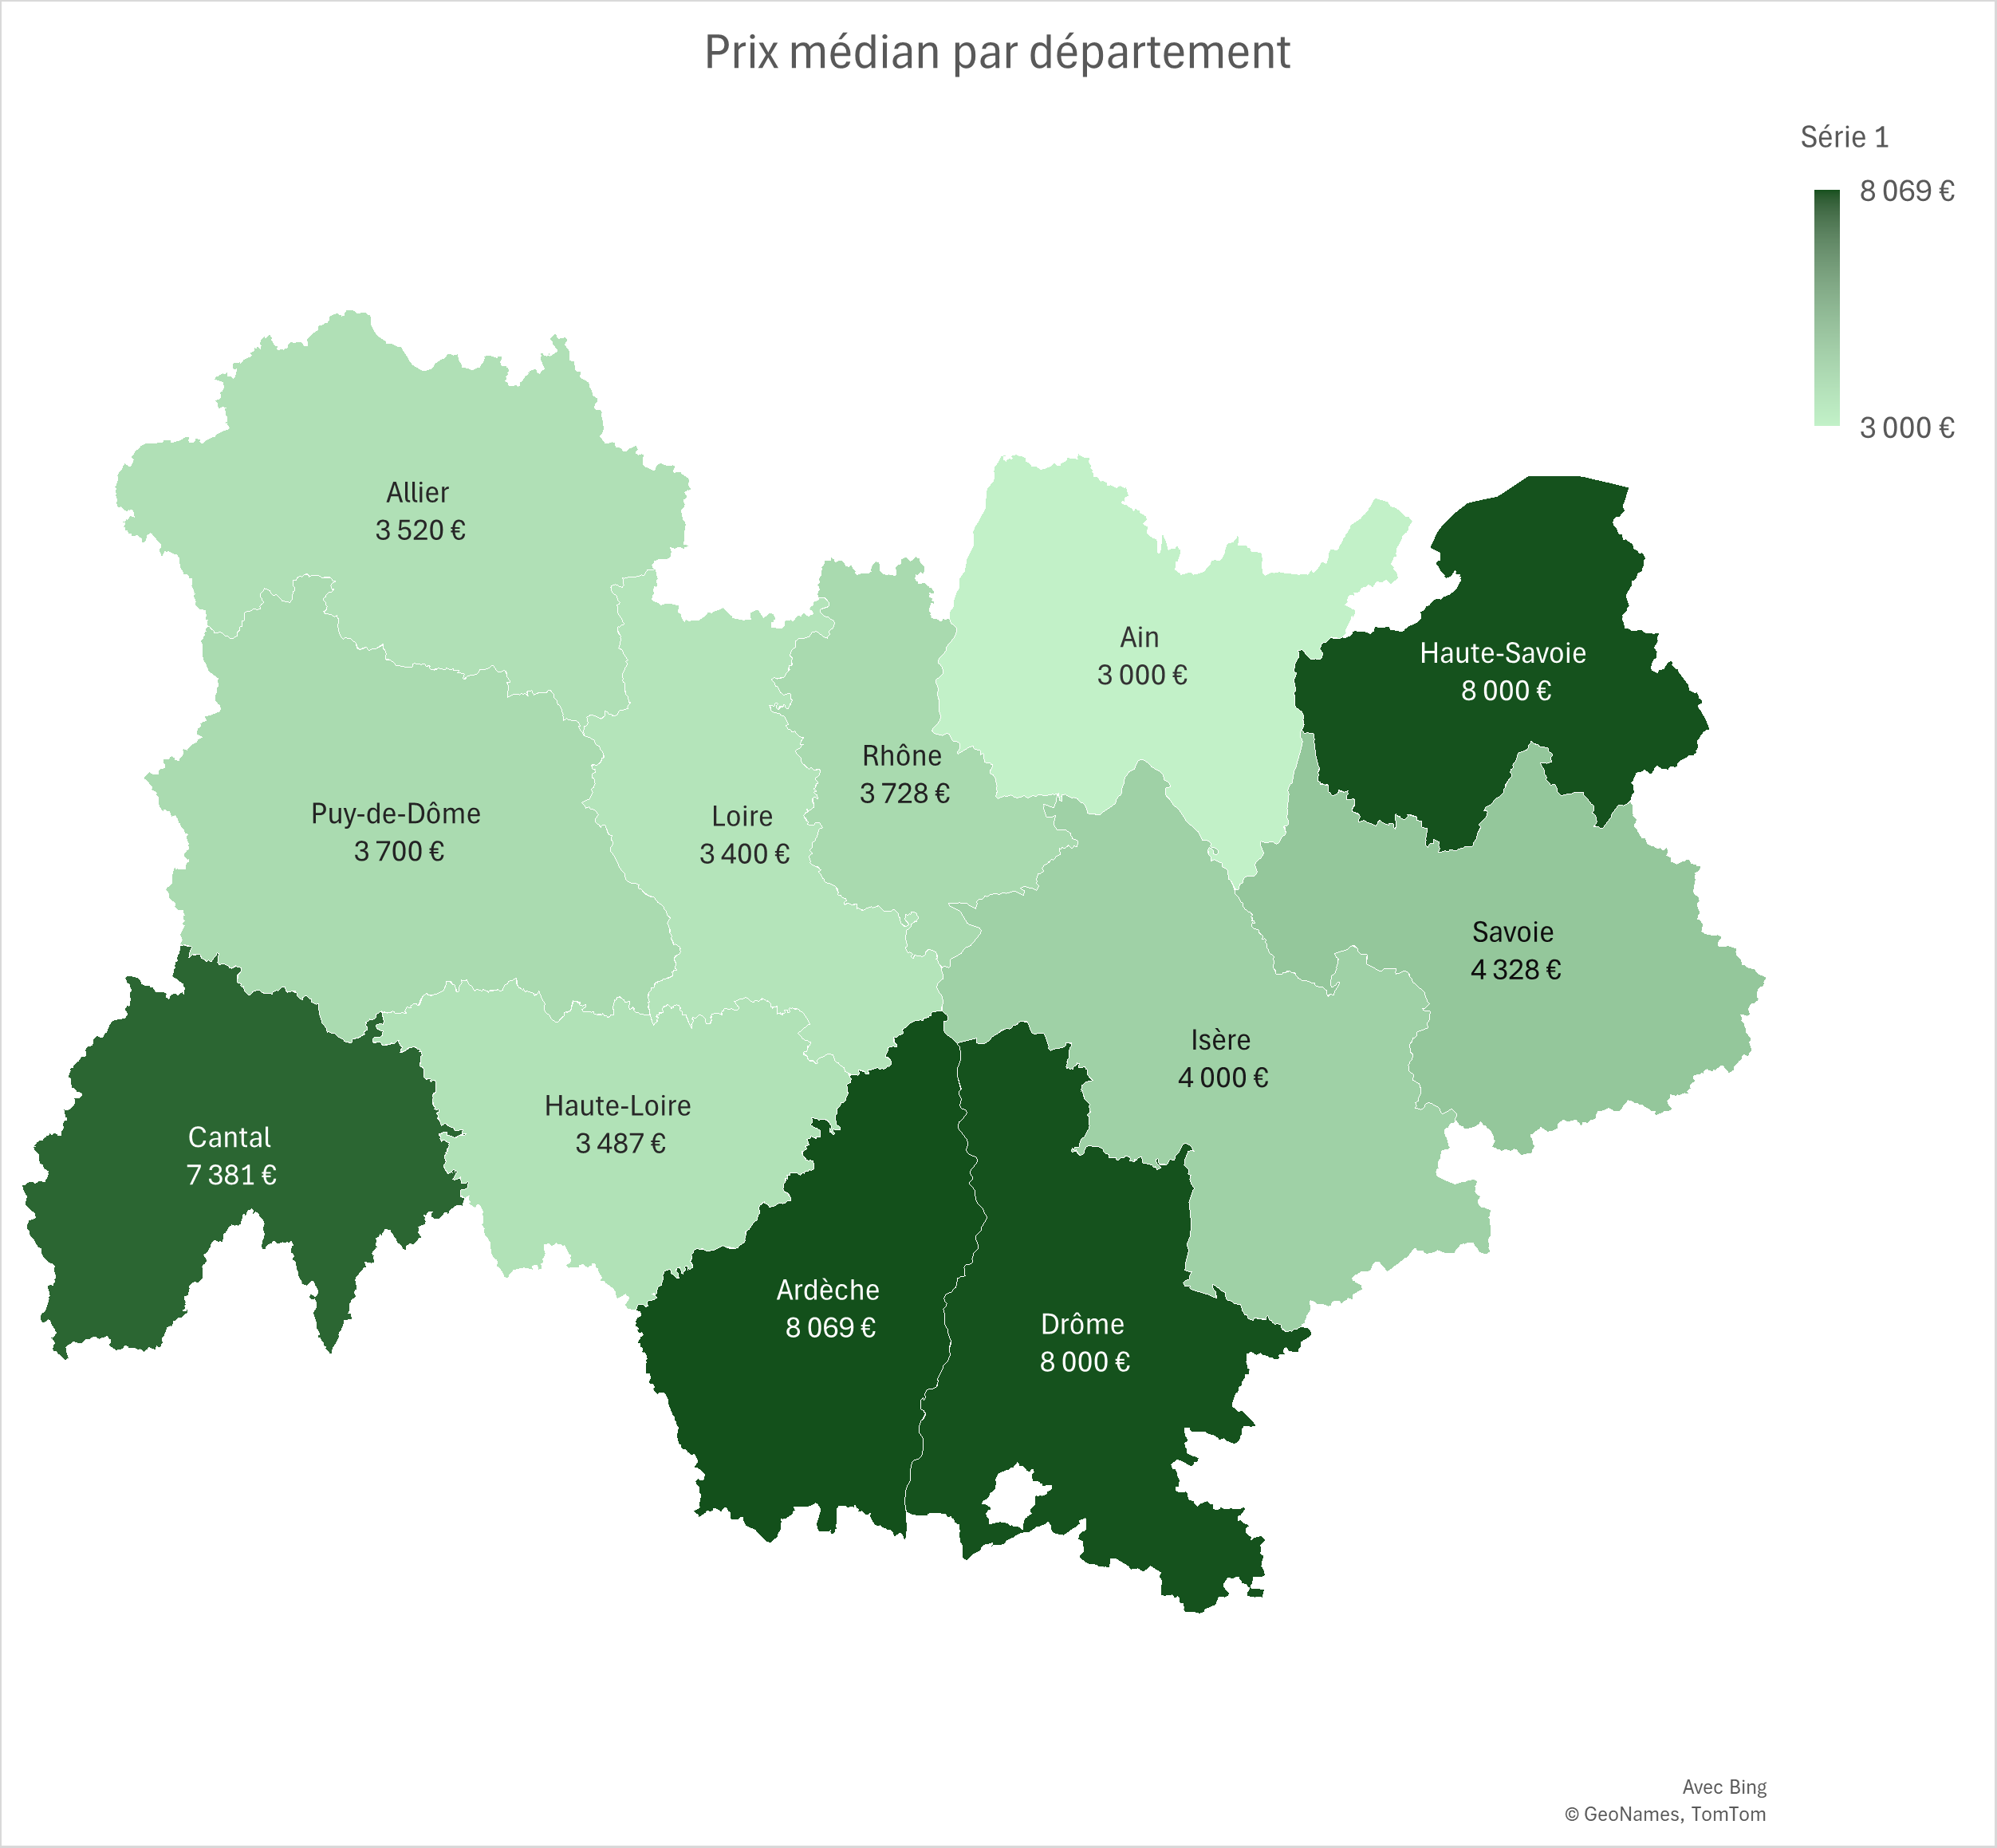
Auvergne-Rhône-Alpes combines vast extensive livestock farming areas (Massif Central, Alpine mountains), cereal-growing basins (Drôme, Ain, Allier) and specialized crops in the Rhône valley. The regional UAA (Utilized Agricultural Area) covers approximately 2.9 million hectares. The main regional agricultural orientations — dairy and suckler cattle farming, mountain AOP cheeses, field crops in Allier and Ain, arboriculture in the Rhône valley, market gardening, PGI productions — shape a land market whose levels and dynamics vary considerably from one department to another.
This article presents agricultural land prices in Auvergne-Rhône-Alpes based on DVF data (Land Value Requests) processed by ma-propriete.fr, supplemented by publications from the Ministry of Agriculture derived from SAFER. The year 2025, now fully available, is commented on as a priority; the year 2024 serves as a comparative reference. The vineyards of the Rhône valley (Côte-Rôtie, Hermitage, Crozes-Hermitage) and southern Beaujolais constitute a specific market, expressly excluded from the scope of this article.
In 2025, the average price of agricultural land in Auvergne-Rhône-Alpes stands at €4,786/ha, a change of +4.0% compared to 2024. The median price, an indicator less sensitive to extreme transactions, reaches €3,887/ha. Over the whole year, 1,230 transactions were recorded in the region with an average area per sale of 9.71 ha.
The gap between the first decile (€2,161/ha) and the ninth decile (€8,738/ha) — a P90/P10 ratio of 4.0 — illustrates the dispersion of prices within the region. This dispersion reflects the heterogeneity of terroirs, the diversity of production orientations and the variability of land pressure across zones.
Over the 2021-2025 period (first years fully covered by DVF), the regional average price is up (+9.3%).
| Year | Number of sales | Average price | Median price | P10 | P90 | Average area |
|---|---|---|---|---|---|---|
| 2020 | 508 | €4,501/ha | €3,617/ha | €2,091/ha | €8,322/ha | 10.42 ha |
| 2021 | 1,097 | €4,378/ha | €3,545/ha | €2,000/ha | €8,217/ha | 9.44 ha |
| 2022 | 1,174 | €4,629/ha | €3,773/ha | €2,201/ha | €8,440/ha | 10.13 ha |
| 2023 | 1,248 | €4,667/ha | €3,666/ha | €2,082/ha | €8,814/ha | 9.09 ha |
| 2024 | 1,156 | €4,602/ha | €3,781/ha | €2,064/ha | €8,336/ha | 9.26 ha |
| 2025 | 1,230 | €4,786/ha | €3,887/ha | €2,161/ha | €8,738/ha | 9.71 ha |
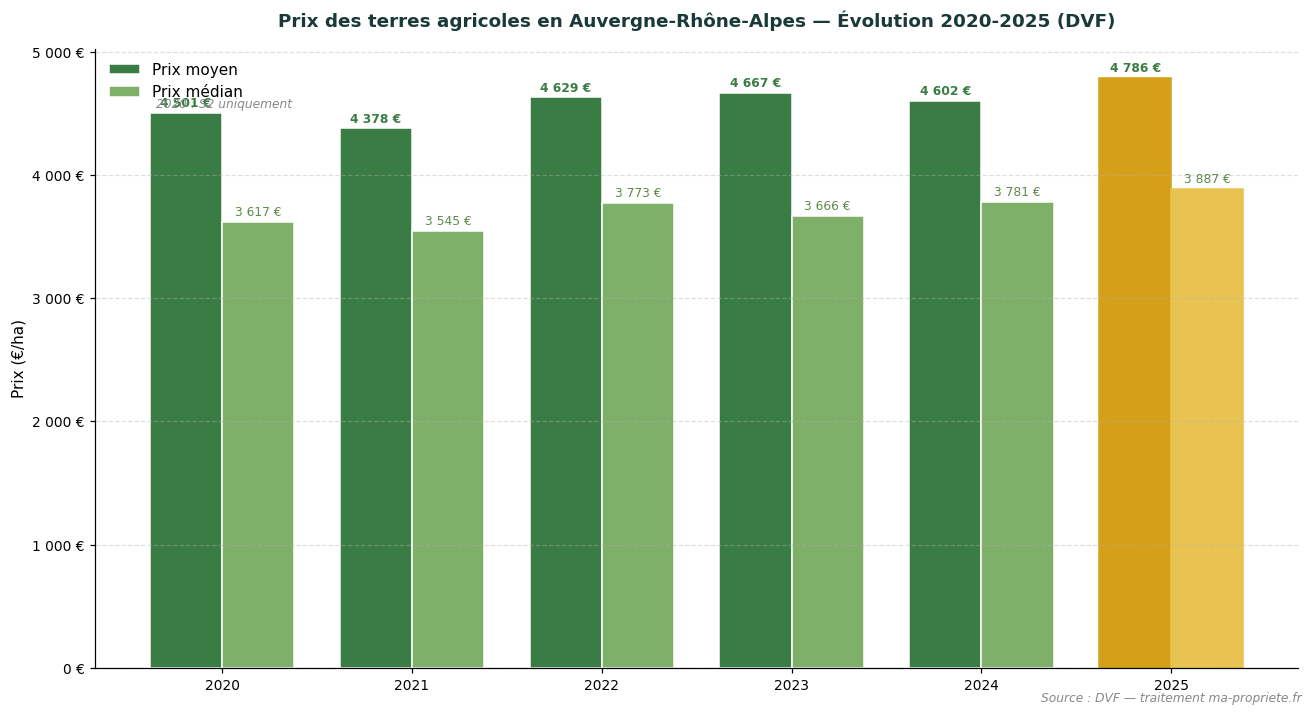
Trend in average and median prices of agricultural land in Auvergne-Rhône-Alpes (2020-2025). Source: DVF, processing by ma-propriete.fr. The year 2025 is highlighted in gold.
The SAFERs publish each year a summary of agricultural land prices, distinguishing sales of free land (parcels not occupied by a tenant farmer) from sales of rented land (parcels already under a rural lease). In Auvergne-Rhône-Alpes, the latest available year is 2024: the average price of free land reaches €4,860/ha, compared to €3,940/ha for rented land. In 2024, the gap between free and rented land reaches 19% in Auvergne-Rhône-Alpes, in line with the national average (~18%).
| Year | Free land (SAFER) | Rented land (SAFER) |
|---|---|---|
| 2015 | €4,920/ha | €3,590/ha |
| 2018 | €4,520/ha | €3,810/ha |
| 2020 | €4,940/ha | €3,840/ha |
| 2022 | €4,780/ha | €3,870/ha |
| 2023 | €4,680/ha | €4,010/ha |
| 2024 | €4,860/ha | €3,940/ha |
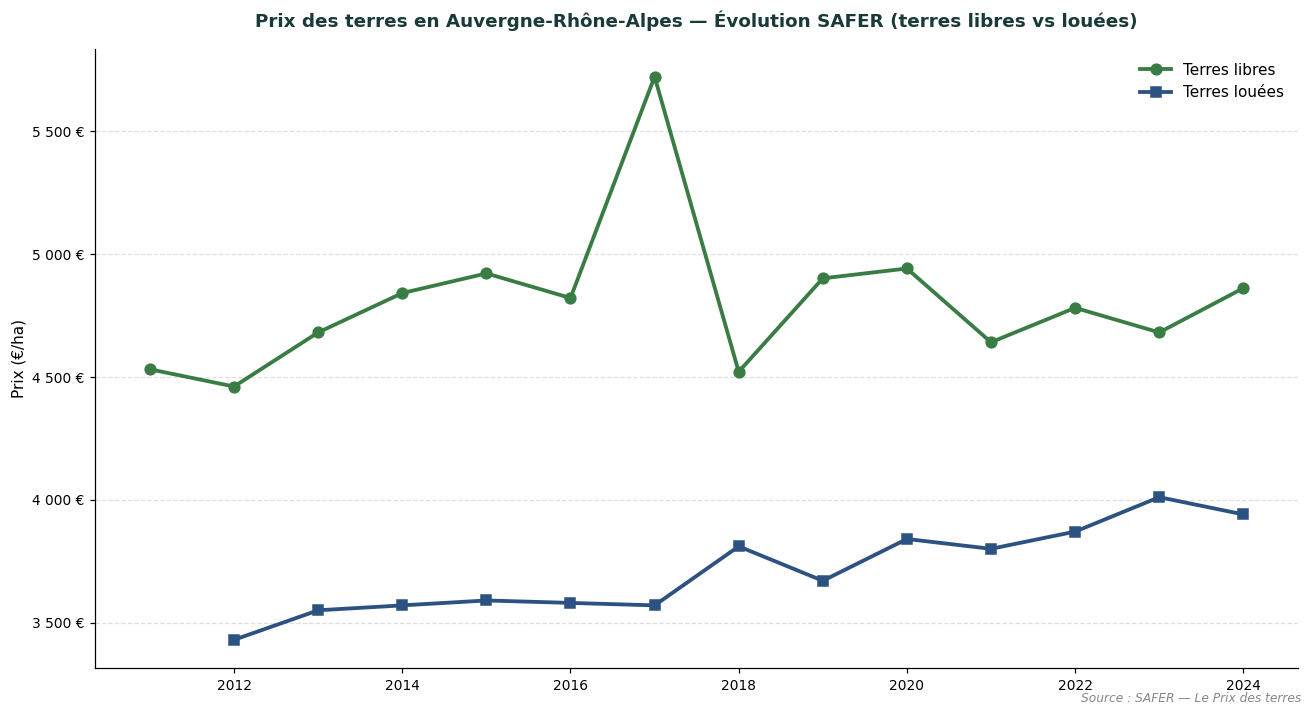
Comparative trend in prices of free and rented land in Auvergne-Rhône-Alpes. Source: SAFER — Land Prices.
SAFER levels are not directly comparable to the DVF levels presented above: SAFER only covers part of the market (transactions subject to pre-emption rights or intermediation), while DVF reports all registered transfers. The two sources are complementary and provide objective insight into the land market from two distinct angles.
Ain combines field crops from the Bresse plain and AOP livestock farming in the Bugey area. In 2025, the average price of agricultural land in the department stands at €3,187/ha (+5.6% compared to 2024). The median price reaches €3,000/ha, based on 144 recorded transactions (average area 9.46 ha).
| Year | No. of sales | Average price | Median price | Average area |
|---|---|---|---|---|
| 2020 | 61 | €3,427/ha | €3,000/ha | 8.70 ha |
| 2021 | 143 | €3,065/ha | €2,528/ha | 9.14 ha |
| 2022 | 128 | €2,873/ha | €2,728/ha | 8.86 ha |
| 2023 | 162 | €3,204/ha | €2,798/ha | 9.07 ha |
| 2024 | 138 | €3,019/ha | €3,000/ha | 9.44 ha |
| 2025 | 144 | €3,187/ha | €3,000/ha | 9.46 ha |
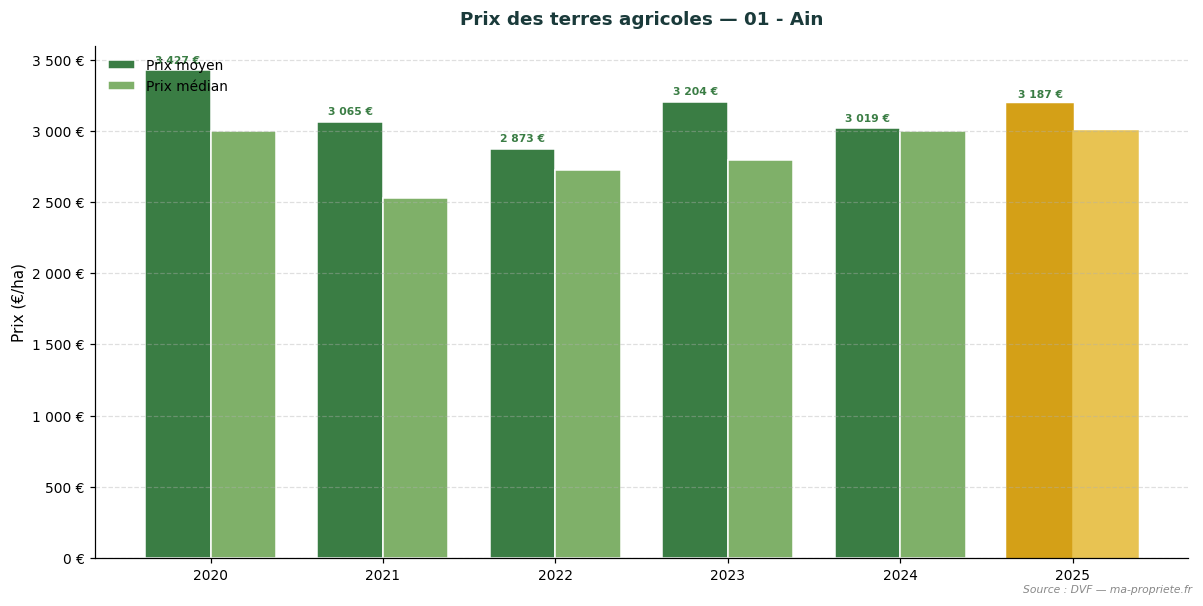
Trend in agricultural land prices — 01 - Ain. Source: DVF, processing by ma-propriete.fr. The year 2025 is highlighted in gold.
Allier is one of the great French Charolais basins, dominated by permanent grasslands. In 2025, the average price of agricultural land in the department stands at €4,174/ha (-1.9% compared to 2024). The median price reaches €3,520/ha, based on 239 recorded transactions (average area 13.37 ha).
| Year | No. of sales | Average price | Median price | Average area |
|---|---|---|---|---|
| 2020 | 121 | €4,248/ha | €3,454/ha | 16.33 ha |
| 2021 | 203 | €3,768/ha | €3,377/ha | 12.69 ha |
| 2022 | 250 | €3,867/ha | €3,500/ha | 15.11 ha |
| 2023 | 266 | €4,009/ha | €3,500/ha | 12.33 ha |
| 2024 | 247 | €4,253/ha | €3,622/ha | 12.68 ha |
| 2025 | 239 | €4,174/ha | €3,520/ha | 13.37 ha |
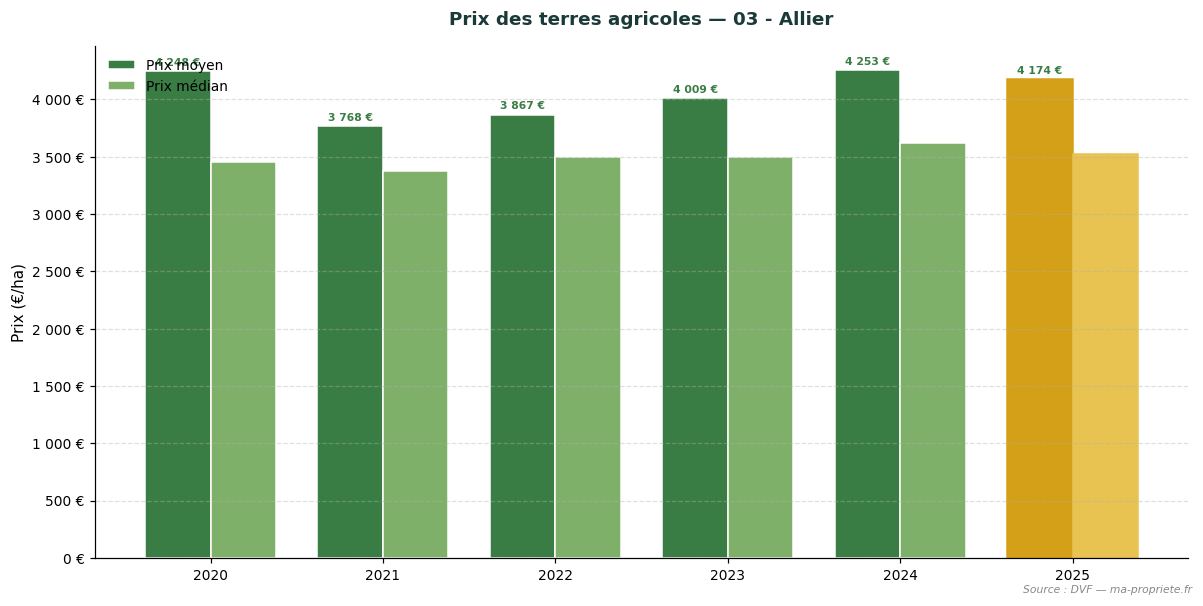
Trend in agricultural land prices — 03 - Allier. Source: DVF, processing by ma-propriete.fr. The year 2025 is highlighted in gold.
Ardèche combines extensive livestock farming, arboriculture (chestnut) and PGI productions. In 2025, the average price of agricultural land in the department stands at €7,860/ha (+70.6% compared to 2024). The median price reaches €8,069/ha, based on 13 recorded transactions (average area 5.64 ha). The low number of transactions (fewer than 30 sales) calls for caution in interpreting annual averages.
| Year | No. of sales | Average price | Median price | Average area |
|---|---|---|---|---|
| 2020 | 7 | €6,427/ha | €6,990/ha | 5.49 ha |
| 2021 | 8 | €3,313/ha | €3,141/ha | 6.03 ha |
| 2022 | 12 | €4,507/ha | €4,388/ha | 7.91 ha |
| 2023 | 11 | €4,531/ha | €3,505/ha | 6.97 ha |
| 2024 | 10 | €4,606/ha | €3,824/ha | 6.26 ha |
| 2025 | 13 | €7,860/ha | €8,069/ha | 5.64 ha |
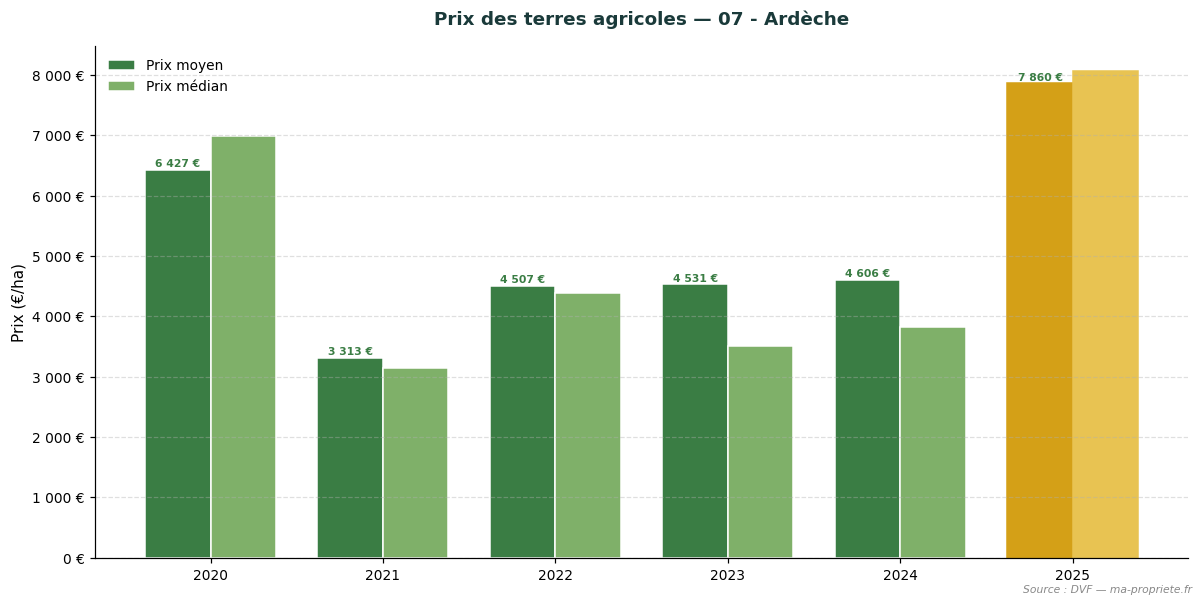
Trend in agricultural land prices — 07 - Ardèche. Source: DVF, processing by ma-propriete.fr. The year 2025 is highlighted in gold.
Cantal, land of mountain AOP cheeses (cantal, salers), structures its market around high-altitude grasslands. In 2025, the average price of agricultural land in the department stands at €7,166/ha (+9.5% compared to 2024). The median price reaches €7,381/ha, based on 136 recorded transactions (average area 11.88 ha).
| Year | No. of sales | Average price | Median price | Average area |
|---|---|---|---|---|
| 2020 | 49 | €7,203/ha | €7,123/ha | 11.07 ha |
| 2021 | 126 | €6,928/ha | €6,495/ha | 13.31 ha |
| 2022 | 139 | €7,010/ha | €6,637/ha | 12.26 ha |
| 2023 | 130 | €7,063/ha | €6,549/ha | 11.85 ha |
| 2024 | 120 | €6,547/ha | €6,309/ha | 10.18 ha |
| 2025 | 136 | €7,166/ha | €7,381/ha | 11.88 ha |
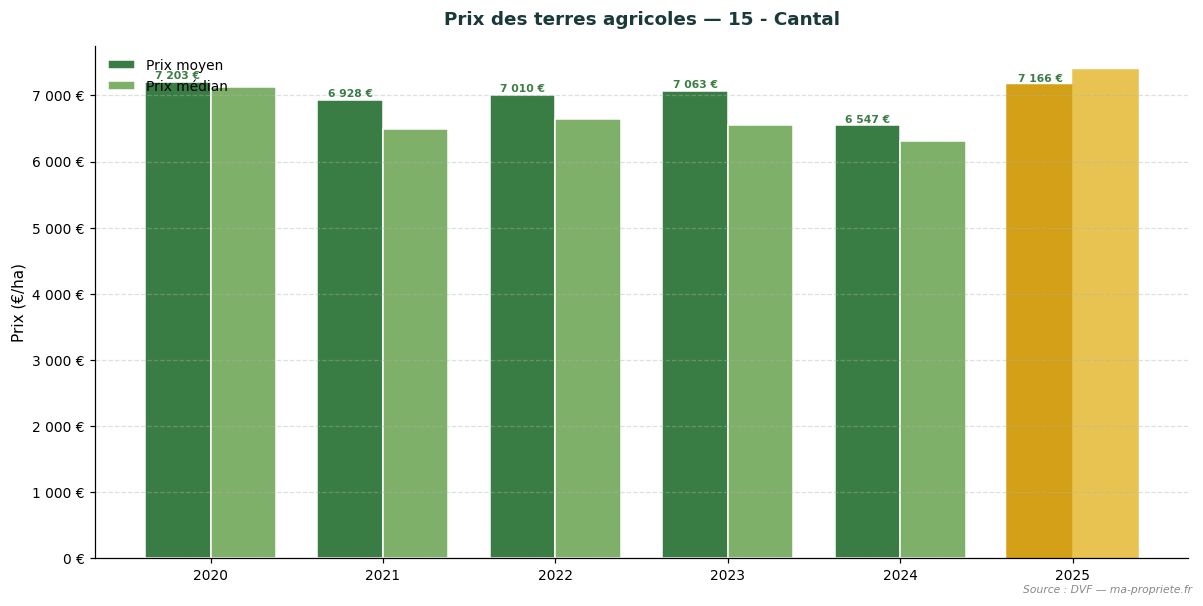
Trend in agricultural land prices — 15 - Cantal. Source: DVF, processing by ma-propriete.fr. The year 2025 is highlighted in gold.
Drôme combines arboriculture (apricot, cherry), market gardening and aromatic plants. In 2025, the average price of agricultural land in the department stands at €8,181/ha (-1.8% compared to 2024). The median price reaches €8,000/ha, based on 63 recorded transactions (average area 7.74 ha).
| Year | No. of sales | Average price | Median price | Average area |
|---|---|---|---|---|
| 2020 | 26 | €6,895/ha | €6,436/ha | 6.39 ha |
| 2021 | 66 | €8,073/ha | €8,003/ha | 6.34 ha |
| 2022 | 56 | €8,476/ha | €8,000/ha | 7.14 ha |
| 2023 | 64 | €7,353/ha | €6,974/ha | 6.11 ha |
| 2024 | 65 | €8,328/ha | €8,000/ha | 5.51 ha |
| 2025 | 63 | €8,181/ha | €8,000/ha | 7.74 ha |
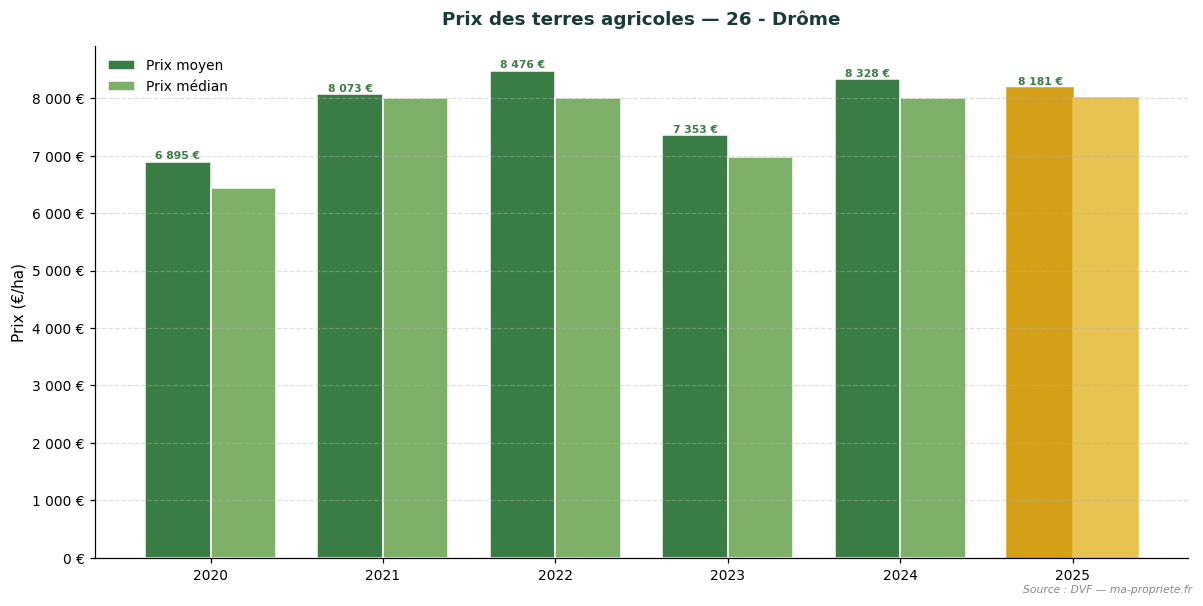
Trend in agricultural land prices — 26 - Drôme. Source: DVF, processing by ma-propriete.fr. The year 2025 is highlighted in gold.
Isère combines lowland field crops with mountain livestock farming in the Alps. In 2025, the average price of agricultural land in the department stands at €4,555/ha (+10.8% compared to 2024). The median price reaches €4,000/ha, based on 79 recorded transactions (average area 5.97 ha).
| Year | No. of sales | Average price | Median price | Average area |
|---|---|---|---|---|
| 2020 | 35 | €3,812/ha | €3,655/ha | 7.04 ha |
| 2021 | 88 | €3,799/ha | €3,605/ha | 6.29 ha |
| 2022 | 94 | €4,186/ha | €3,613/ha | 7.57 ha |
| 2023 | 77 | €4,178/ha | €3,950/ha | 5.49 ha |
| 2024 | 73 | €4,110/ha | €4,000/ha | 5.96 ha |
| 2025 | 79 | €4,555/ha | €4,000/ha | 5.97 ha |
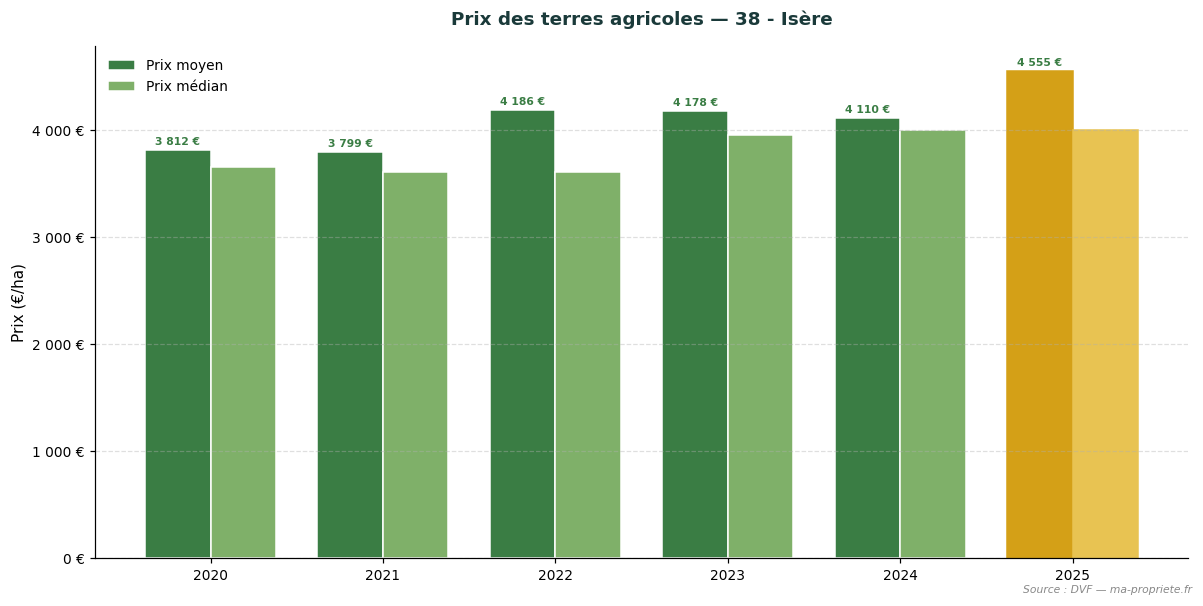
Trend in agricultural land prices — 38 - Isère. Source: DVF, processing by ma-propriete.fr. The year 2025 is highlighted in gold.
Loire combines suckler cattle farming, mixed farming and label-certified productions. In 2025, the average price of agricultural land in the department stands at €3,474/ha (+3.4% compared to 2024). The median price reaches €3,400/ha, based on 107 recorded transactions (average area 9.26 ha).
| Year | No. of sales | Average price | Median price | Average area |
|---|---|---|---|---|
| 2020 | 54 | €3,523/ha | €3,240/ha | 10.17 ha |
| 2021 | 119 | €3,473/ha | €3,000/ha | 8.49 ha |
| 2022 | 133 | €3,426/ha | €3,089/ha | 9.20 ha |
| 2023 | 129 | €3,601/ha | €3,105/ha | 8.12 ha |
| 2024 | 107 | €3,360/ha | €3,150/ha | 8.47 ha |
| 2025 | 107 | €3,474/ha | €3,400/ha | 9.26 ha |
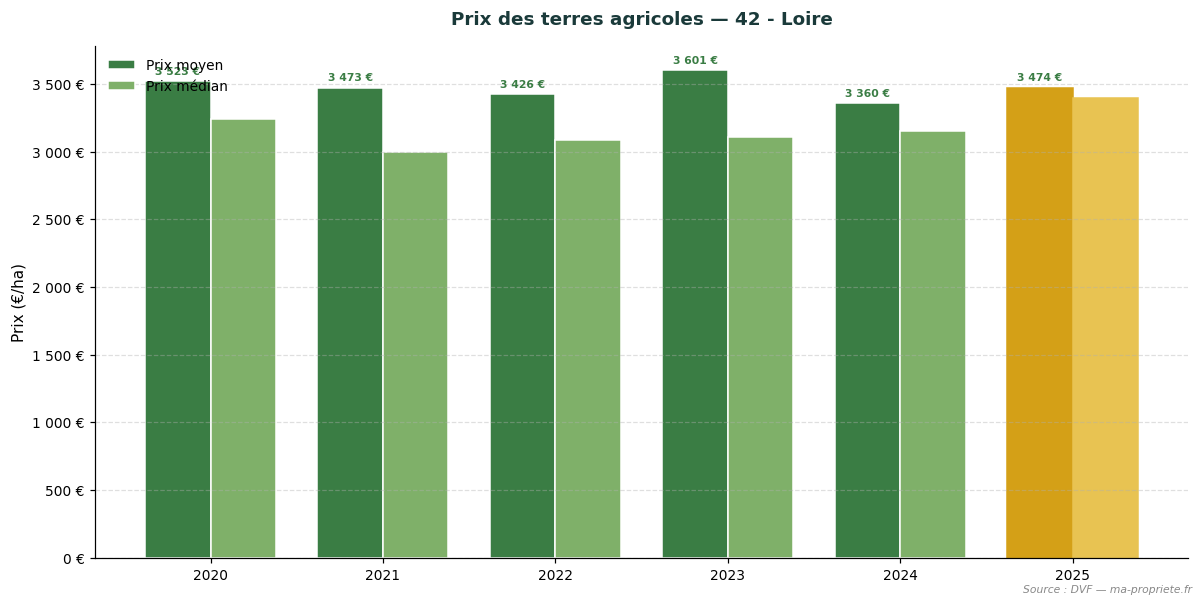
Trend in agricultural land prices — 42 - Loire. Source: DVF, processing by ma-propriete.fr. The year 2025 is highlighted in gold.
Haute-Loire, predominantly devoted to mountain livestock farming, shows a moderate market. In 2025, the average price of agricultural land in the department stands at €4,009/ha (+0.1% compared to 2024). The median price reaches €3,487/ha, based on 93 recorded transactions (average area 8.06 ha).
| Year | No. of sales | Average price | Median price | Average area |
|---|---|---|---|---|
| 2020 | 37 | €3,520/ha | €3,223/ha | 6.34 ha |
| 2021 | 64 | €3,246/ha | €3,024/ha | 7.65 ha |
| 2022 | 103 | €3,876/ha | €3,547/ha | 7.12 ha |
| 2023 | 82 | €3,905/ha | €3,539/ha | 6.75 ha |
| 2024 | 87 | €4,004/ha | €3,763/ha | 7.85 ha |
| 2025 | 93 | €4,009/ha | €3,487/ha | 8.06 ha |
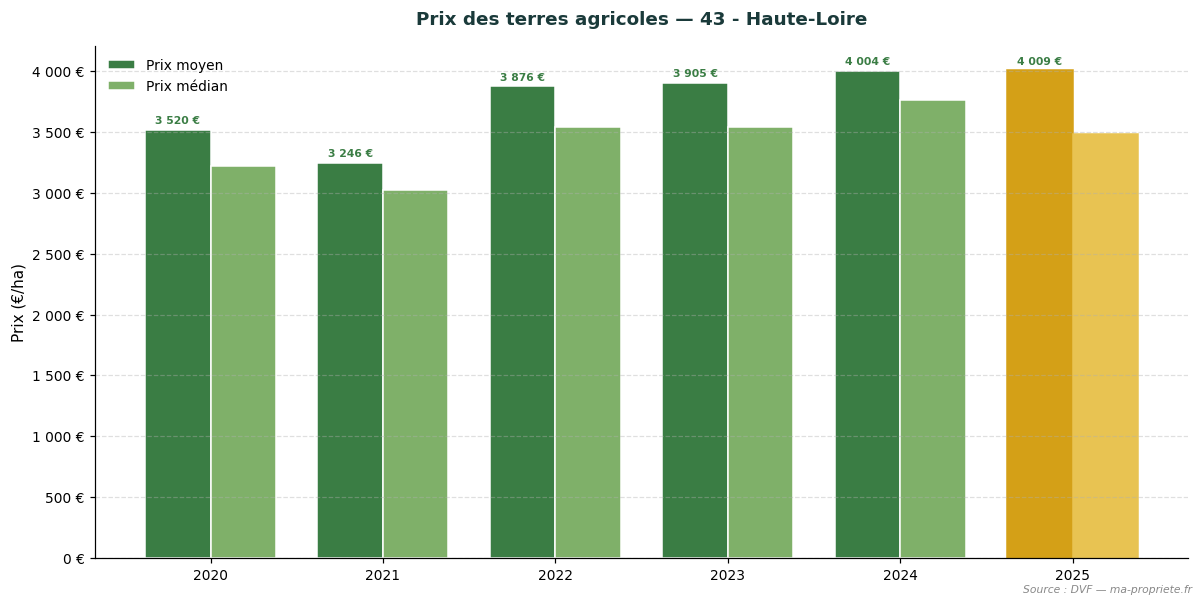
Trend in agricultural land prices — 43 - Haute-Loire. Source: DVF, processing by ma-propriete.fr. The year 2025 is highlighted in gold.
Puy-de-Dôme combines field crops from the Limagne plain with mountain livestock farming. In 2025, the average price of agricultural land in the department stands at €4,808/ha (+11.9% compared to 2024). The median price reaches €3,700/ha, based on 243 recorded transactions (average area 8.86 ha).
| Year | No. of sales | Average price | Median price | Average area |
|---|---|---|---|---|
| 2020 | 84 | €4,095/ha | €3,660/ha | 9.19 ha |
| 2021 | 187 | €4,200/ha | €3,070/ha | 8.69 ha |
| 2022 | 175 | €4,924/ha | €4,135/ha | 8.55 ha |
| 2023 | 219 | €5,104/ha | €3,916/ha | 8.70 ha |
| 2024 | 205 | €4,297/ha | €3,107/ha | 8.96 ha |
| 2025 | 243 | €4,808/ha | €3,700/ha | 8.86 ha |
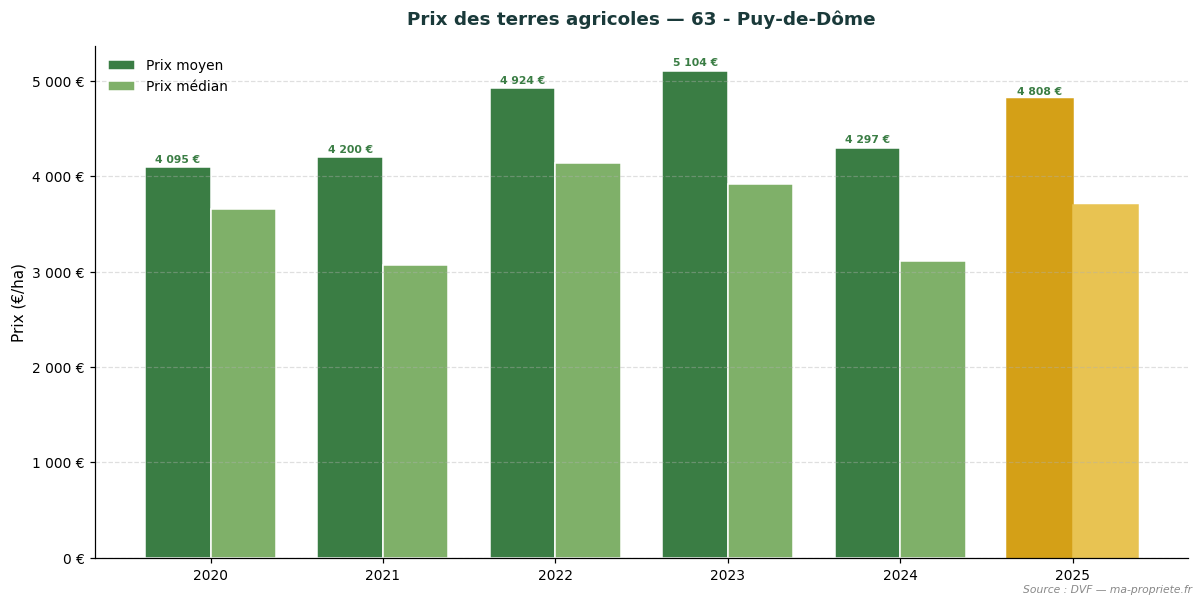
Trend in agricultural land prices — 63 - Puy-de-Dôme. Source: DVF, processing by ma-propriete.fr. The year 2025 is highlighted in gold.
Rhône combines arboriculture, market gardening and livestock farming in the agricultural Beaujolais area. In 2025, the average price of agricultural land in the department stands at €4,254/ha (+4.1% compared to 2024). The median price reaches €3,728/ha, based on 71 recorded transactions (average area 8.48 ha).
| Year | No. of sales | Average price | Median price | Average area |
|---|---|---|---|---|
| 2020 | 21 | €4,865/ha | €4,319/ha | 8.08 ha |
| 2021 | 56 | €3,375/ha | €2,980/ha | 7.52 ha |
| 2022 | 50 | €4,208/ha | €3,656/ha | 8.81 ha |
| 2023 | 68 | €4,514/ha | €3,316/ha | 6.24 ha |
| 2024 | 66 | €4,086/ha | €3,740/ha | 8.49 ha |
| 2025 | 71 | €4,254/ha | €3,728/ha | 8.48 ha |
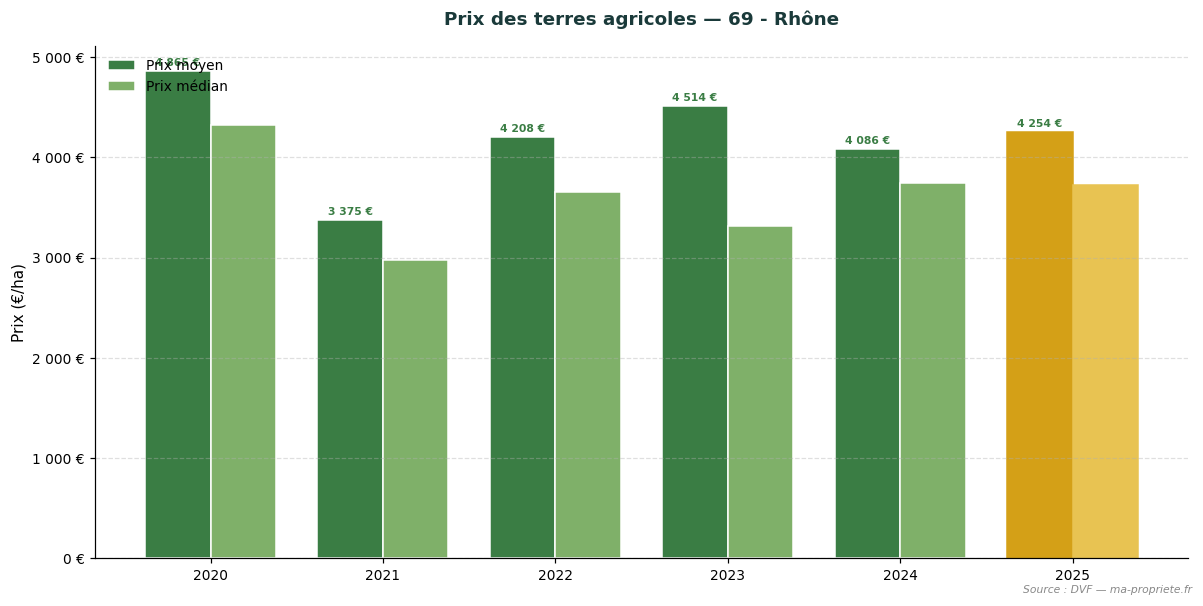
Trend in agricultural land prices — 69 - Rhône. Source: DVF, processing by ma-propriete.fr. The year 2025 is highlighted in gold.
Savoie, dominated by mountain AOP dairy farming, has a market constrained by the terrain. In 2025, the average price of agricultural land in the department stands at €4,986/ha (-23.7% compared to 2024). The median price reaches €4,328/ha, based on 23 recorded transactions (average area 6.22 ha). The low number of transactions (fewer than 30 sales) calls for caution in interpreting annual averages.
| Year | No. of sales | Average price | Median price | Average area |
|---|---|---|---|---|
| 2020 | 7 | €3,411/ha | €2,867/ha | 4.50 ha |
| 2021 | 18 | €5,709/ha | €5,429/ha | 5.49 ha |
| 2022 | 16 | €6,760/ha | €4,153/ha | 5.00 ha |
| 2023 | 21 | €4,451/ha | €4,000/ha | 5.77 ha |
| 2024 | 18 | €6,535/ha | €5,339/ha | 5.93 ha |
| 2025 | 23 | €4,986/ha | €4,328/ha | 6.22 ha |
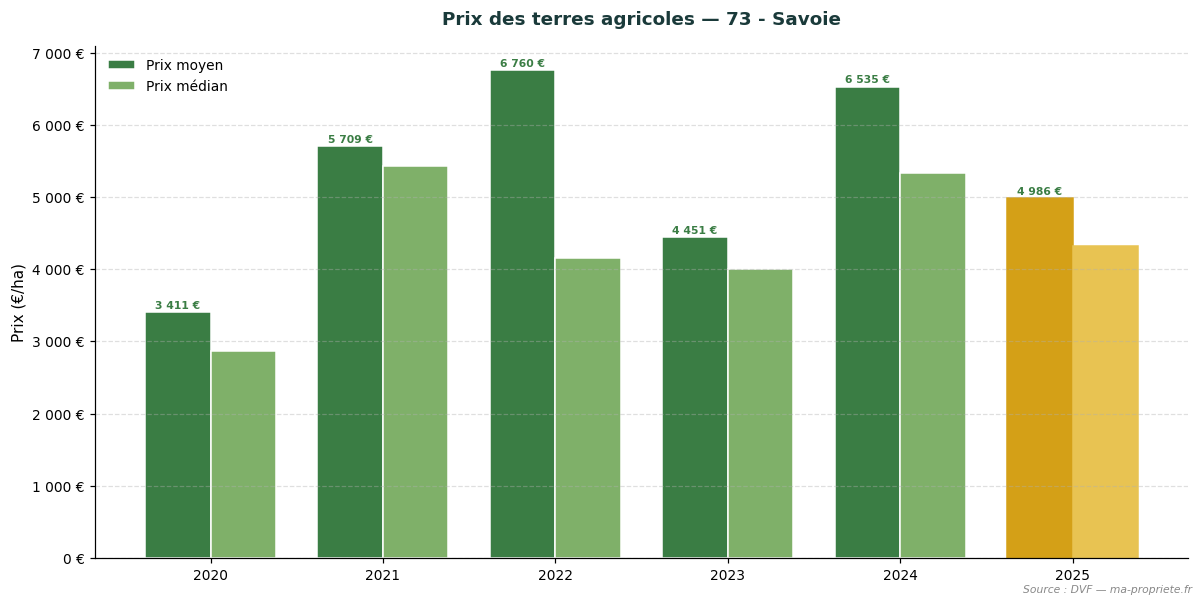
Trend in agricultural land prices — 73 - Savoie. Source: DVF, processing by ma-propriete.fr. The year 2025 is highlighted in gold.
Haute-Savoie, predominantly devoted to mountain AOP livestock farming (reblochon, abondance), structures its market around high-altitude grasslands. In 2025, the average price of agricultural land in the department stands at €7,821/ha (-23.2% compared to 2024). The median price reaches €8,000/ha, based on 19 recorded transactions (average area 4.89 ha). The low number of transactions (fewer than 30 sales) calls for caution in interpreting annual averages.
| Year | No. of sales | Average price | Median price | Average area |
|---|---|---|---|---|
| 2020 | 6 | €10,405/ha | €8,921/ha | 5.92 ha |
| 2021 | 19 | €7,079/ha | €6,386/ha | 6.67 ha |
| 2022 | 18 | €9,354/ha | €7,066/ha | 5.20 ha |
| 2023 | 19 | €9,239/ha | €8,804/ha | 6.08 ha |
| 2024 | 20 | €10,183/ha | €9,380/ha | 5.22 ha |
| 2025 | 19 | €7,821/ha | €8,000/ha | 4.89 ha |
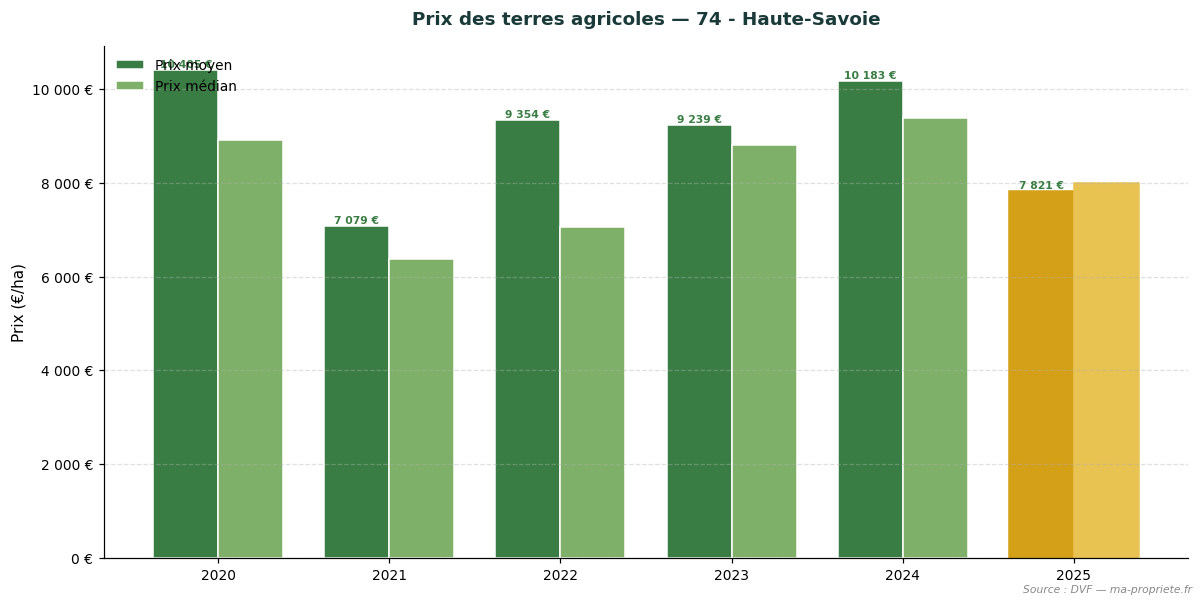
Trend in agricultural land prices — 74 - Haute-Savoie. Source: DVF, processing by ma-propriete.fr. The year 2025 is highlighted in gold.
The statistics presented in this article are based on the DVF (Land Value Requests) database, opened by the Directorate General of Public Finance. This database lists all real estate land transfers registered in metropolitan France and the overseas departments. We applied rigorous filtering to retain only transactions corresponding to strictly agricultural parcels (arable land, grasslands, specialized crops excluding vineyards), systematically excluding built properties, vineyards and AOC vineyards, as well as mixed sales combining parcels and buildings.
For each retained transaction, we calculate the price per hectare by relating the declared land value to the area of the transferred property. Regional and departmental statistics then aggregate these unit values: average price, median price, first decile (P10) and ninth decile (P90), average area, as well as the total number of annual sales.
The use of DVF data calls for several methodological precautions.
The statistics published each year by the SAFERs (Land Development and Rural Establishment Companies) and the Ministry of Agriculture differ from our DVF approach on several points. The SAFERs rely on transactions subject to their pre-emption right or their intermediation, which covers only part of the market. They also explicitly distinguish sales of free land (not occupied by a tenant farmer) from sales of rented land (already under a rural lease), with a structural gap of approximately 18% discount for the latter.
The DVF approach, more exhaustive, includes all registered transfers without distinction of rental status. This explains why the average DVF levels may differ from SAFER publications, particularly in regions where the share of rented land sales is significant. We present both series in parallel to offer the most complete view possible of the agricultural land market.
The year 2025 confirms the stability of the agricultural land market in Auvergne-Rhône-Alpes as a whole, with a regional average price of €4,786/ha (+4.0% vs 2024). Behind this average, the 12 departments of the region show differentiated dynamics that reflect the diversity of terroirs and production orientations. It is one of the regions where the divide between plains and mountain areas is most marked. Cantal, Lozère and Haute-Loire remain at very accessible prices, while Drôme, Ardèche and Isère display significantly higher levels.
To regularly monitor the evolution of the agricultural land market, consult the agricultural land price observatory from ma-propriete.fr, as well as the agricultural section and the agricultural listings published on our portal.
To deepen the analysis of the French agricultural land market, find our articles dedicated to each region.