Updated May 7, 2026: CONSULT OUR AGRICULTURAL LAND PRICE OBSERVATORY IN FRANCE
Summary of the main DVF statistics for the year 2025, now available in its entirety. The figures below relate exclusively to agricultural land excluding vineyards (arable crops, grasslands, ploughable land, specialised crops).
| Key figures 2025 — Normandy | |
|---|---|
| Average price | 8,905 €/ha |
| Median price | 8,305 €/ha |
| First decile (P10) | 5,139 €/ha |
| Ninth decile (P90) | 13,206 €/ha |
| Number of sales | 1,442 |
| Average area | 10.05 ha |
| Change vs 2024 | +2.7% |
Normandy stands out for its intensive grassland and arable farming, from the loamy plains of the Caux to the pastures of the Manche and Orne. The Norman UAA (utilised agricultural area) represents nearly 1.9 million hectares, or two thirds of the regional territory. The main regional agricultural orientations — dairy and beef cattle farming, large-scale cereal crops in Seine-Maritime, Eure and Calvados, mixed crop-livestock farming in Manche and Orne, industrial crops (flax, sugar beet, potato) — shape a land market whose levels and dynamics differ greatly from one département to another.
This article presents agricultural land prices in Normandy based on DVF data (Demandes de Valeurs Foncières) processed by ma-propriete.fr, supplemented by publications from the Ministry of Agriculture sourced from the SAFER. The year 2025, now available in its entirety, is commented on as a priority; the year 2024 serves as a comparative reference.
In 2025, the average price of agricultural land in Normandy stands at 8,905 €/ha, representing a change of +2.7% compared to 2024. The median price, an indicator less sensitive to extreme transactions, reaches 8,305 €/ha. Over the full year, 1,442 transactions were recorded in the region, with an average area per sale of 10.05 ha.
The gap between the first decile (5,139 €/ha) and the ninth decile (13,206 €/ha) — a P90/P10 ratio of 2.6 — illustrates the dispersion of prices within the region. This dispersion reflects the heterogeneity of terroirs, the diversity of productive orientations and the variability of land pressure depending on the area.
Over the 2021–2025 period (the first years fully covered by DVF), the regional average price has risen (+9.8%).
| Year | Number of sales | Average price | Median price | P10 | P90 | Average area |
|---|---|---|---|---|---|---|
| 2020 | 740 | 8,027 €/ha | 7,648 €/ha | 4,820 €/ha | 11,842 €/ha | 8.72 ha |
| 2021 | 1,479 | 8,109 €/ha | 7,809 €/ha | 4,667 €/ha | 12,000 €/ha | 9.28 ha |
| 2022 | 1,484 | 8,529 €/ha | 7,964 €/ha | 5,000 €/ha | 12,505 €/ha | 9.77 ha |
| 2023 | 1,511 | 8,682 €/ha | 8,000 €/ha | 5,128 €/ha | 12,997 €/ha | 9.40 ha |
| 2024 | 1,458 | 8,668 €/ha | 8,000 €/ha | 5,065 €/ha | 13,000 €/ha | 9.47 ha |
| 2025 | 1,442 | 8,905 €/ha | 8,305 €/ha | 5,139 €/ha | 13,206 €/ha | 10.05 ha |
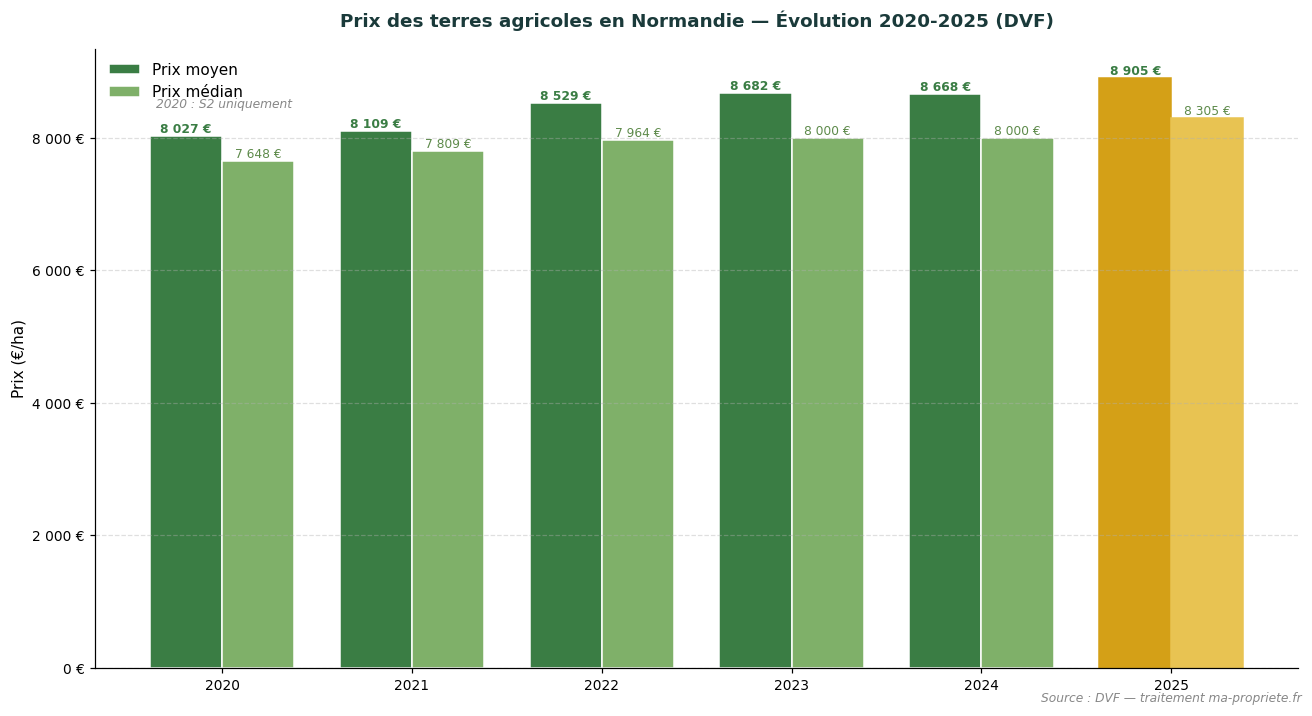
Trend in average and median agricultural land prices in Normandy (2020–2025). Source: DVF, processed by ma-propriete.fr. The year 2025 is highlighted in golden colour.
The SAFER publish an annual summary of agricultural land prices, distinguishing between sales of freehold land (plots not occupied by a tenant farmer) and sales of tenanted land (plots already under a rural lease). In Normandy, the most recent available year is 2024: the average price of freehold land reaches 9,340 €/ha, compared to 8,200 €/ha for tenanted land. In 2024, the gap between freehold and tenanted land reaches 12% in Normandy, in line with the national average (~18%).
| Year | Freehold land (SAFER) | Tenanted land (SAFER) |
|---|---|---|
| 2015 | 8,200 €/ha | 6,570 €/ha |
| 2018 | 8,180 €/ha | 6,940 €/ha |
| 2020 | 8,580 €/ha | 7,540 €/ha |
| 2022 | 9,010 €/ha | 7,500 €/ha |
| 2023 | 9,020 €/ha | 7,910 €/ha |
| 2024 | 9,340 €/ha | 8,200 €/ha |
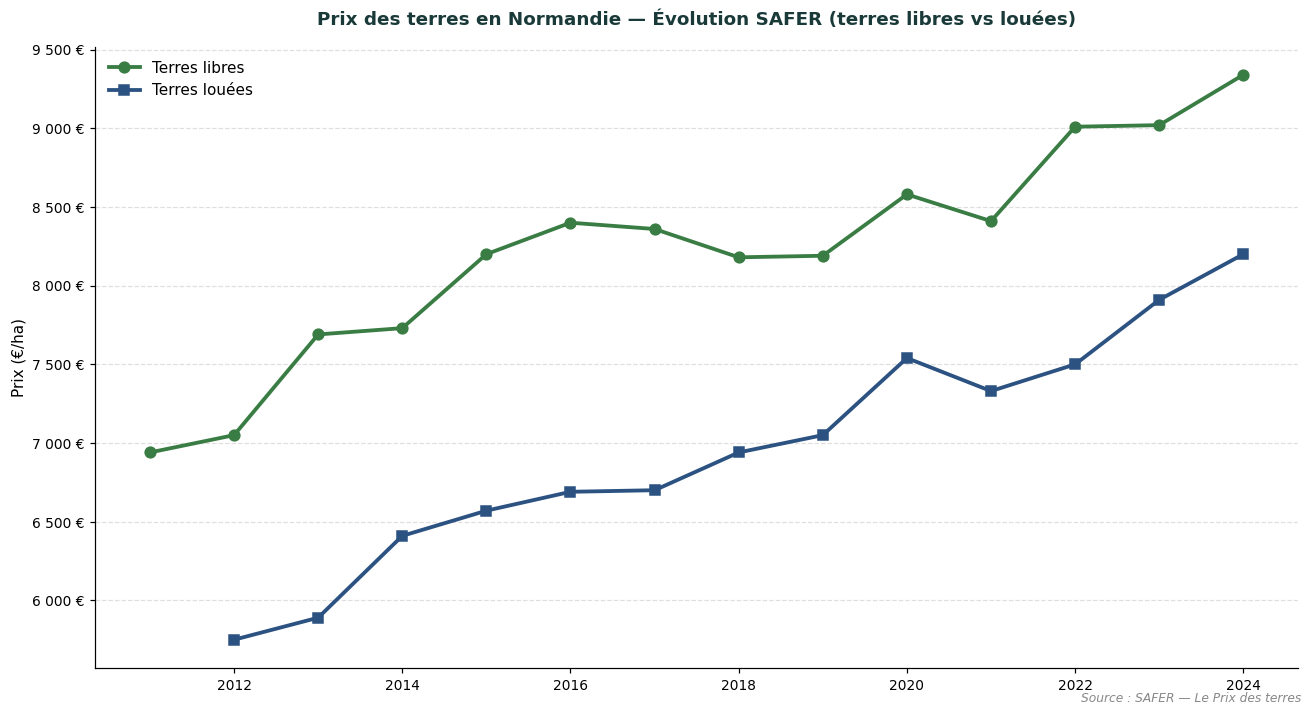
Comparative trend in freehold and tenanted land prices in Normandy. Source: SAFER — Le Prix des terres.
The SAFER figures cannot be directly overlaid onto the DVF figures presented above: the SAFER only cover a portion of the market (transactions subject to pre-emption rights or intermediation), whereas DVF captures all recorded transfers. The two sources are complementary and allow the land market to be objectively assessed from two distinct angles.
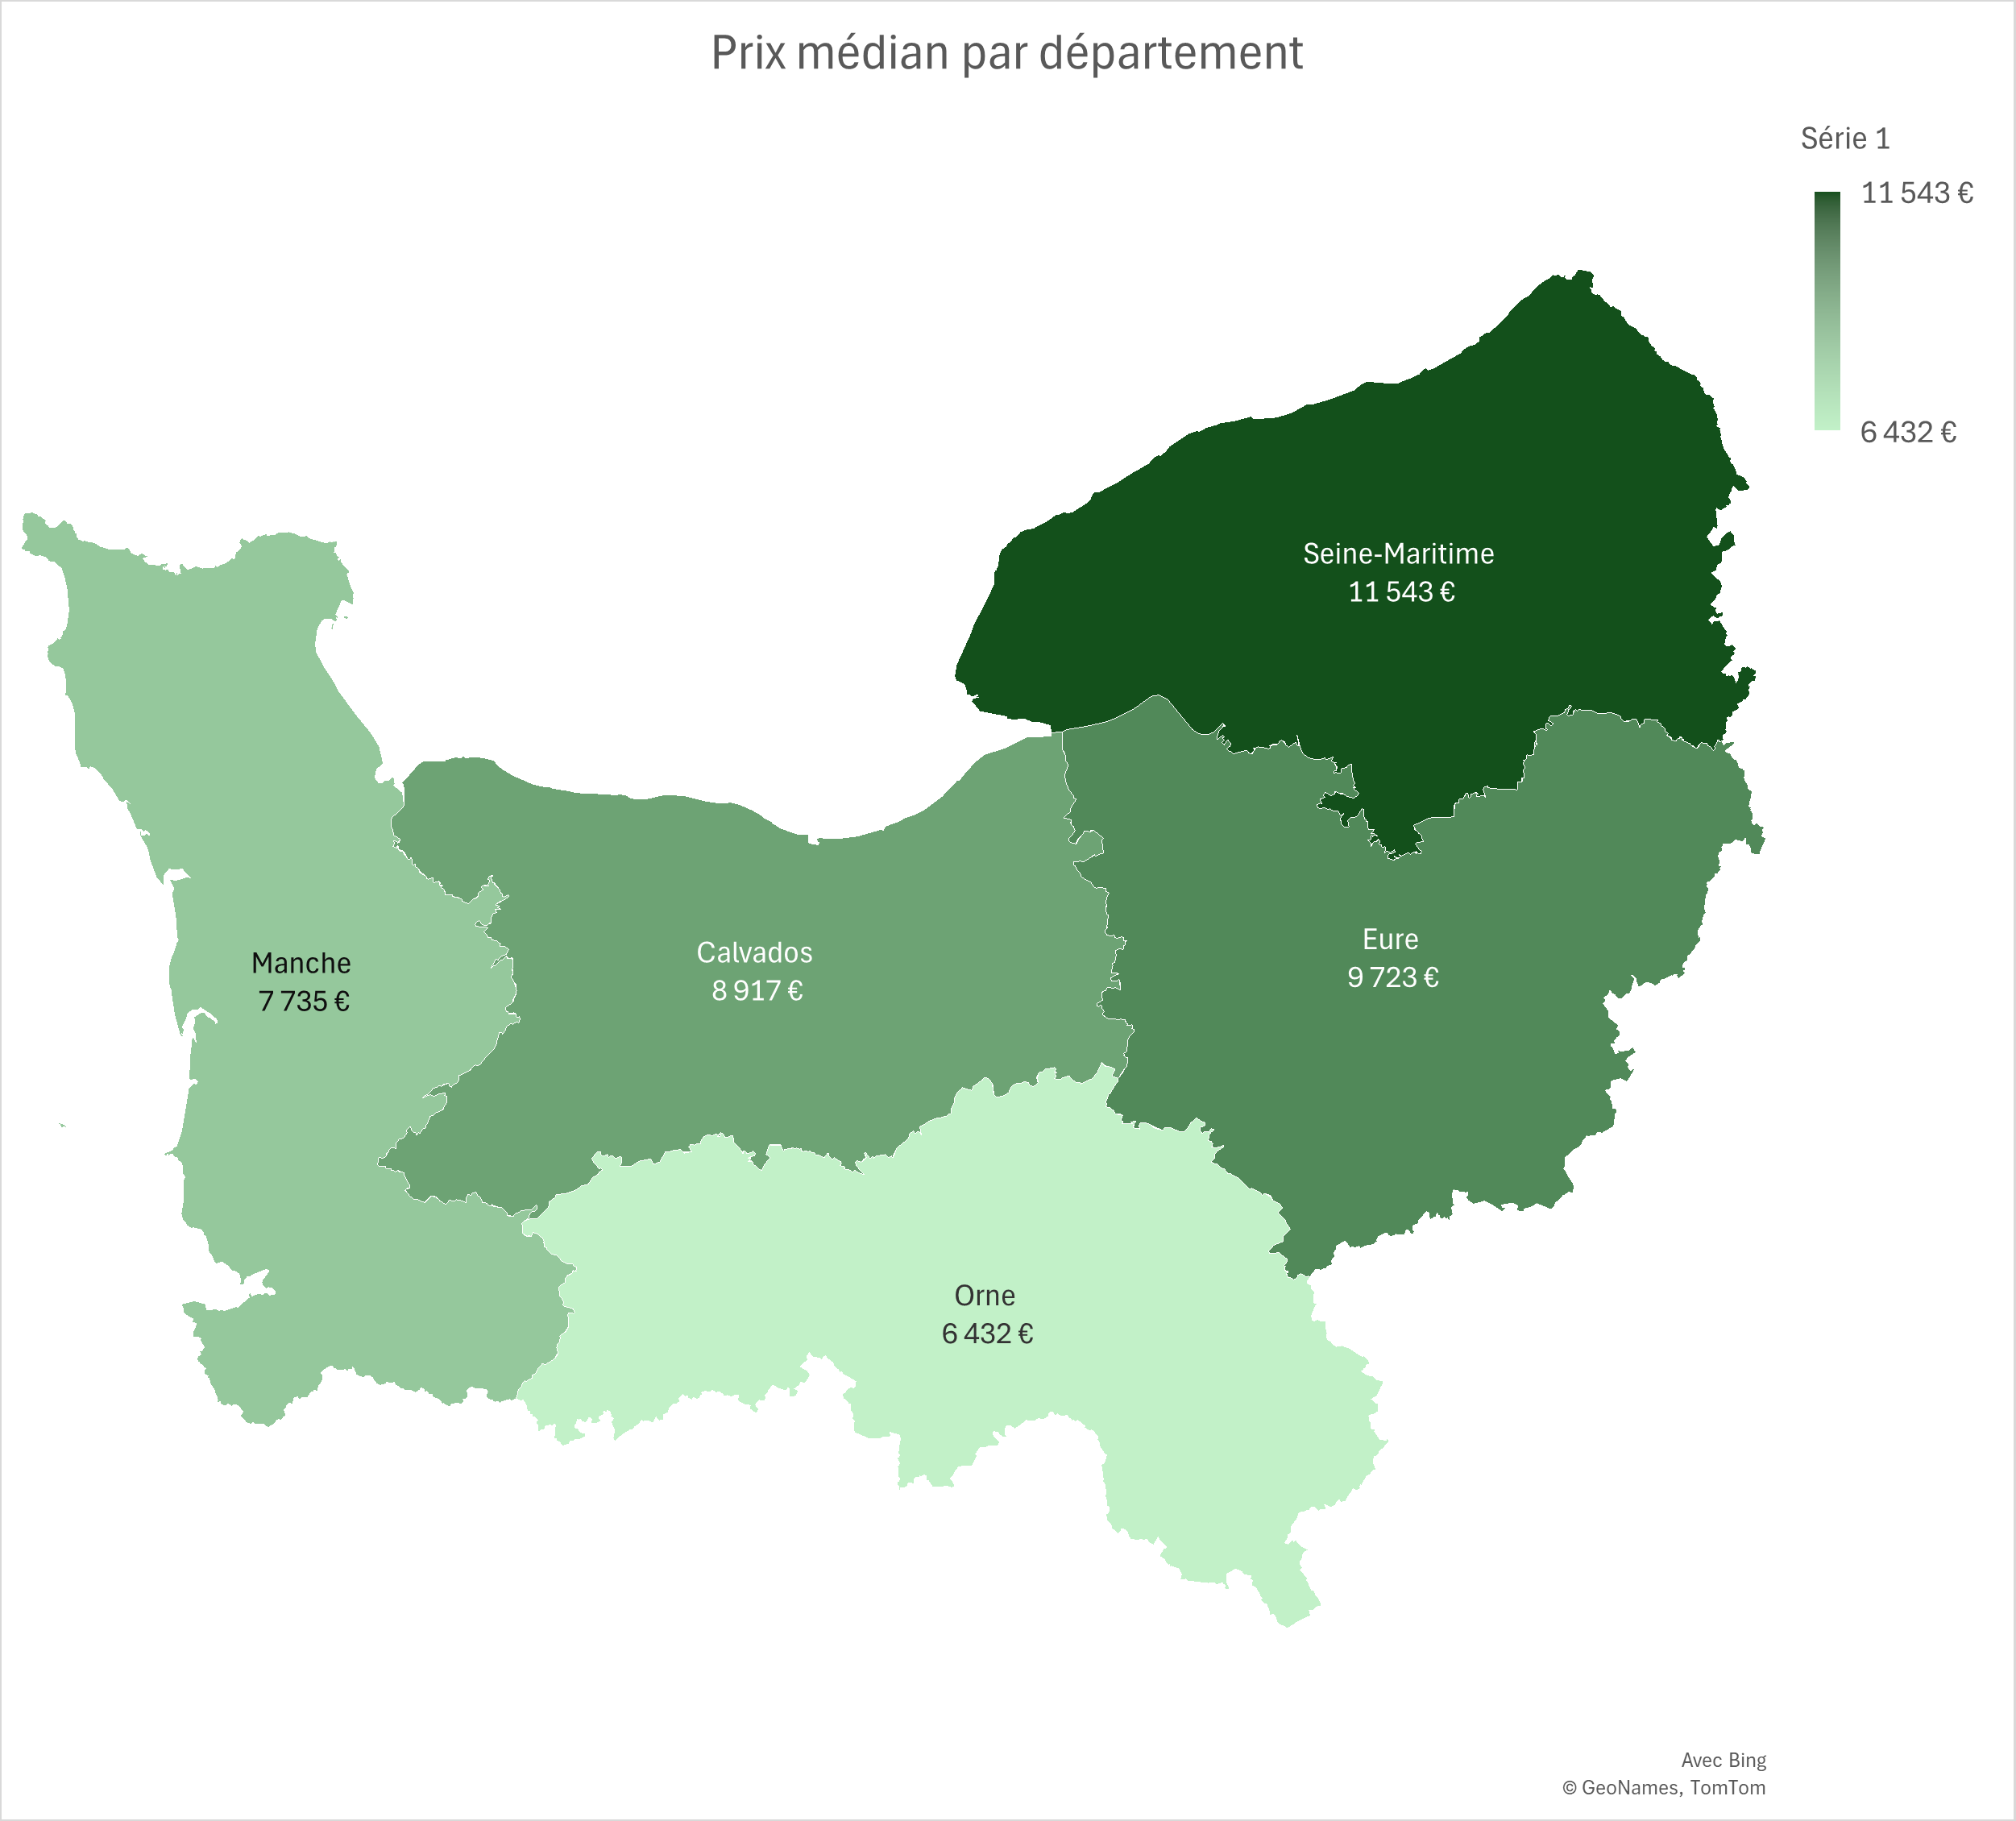
Calvados combines the cereal plain of Caen with the Augeron bocage, with a strong dairy presence. In 2025, the average price of agricultural land in the département stands at 9,368 €/ha (-4.3% compared to 2024). The median price reaches 8,917 €/ha, based on 301 recorded transactions (average area 9.85 ha).
| Year | No. of sales | Average price | Median price | Avg. area |
|---|---|---|---|---|
| 2020 | 144 | 8,621 €/ha | 8,638 €/ha | 8.45 ha |
| 2021 | 297 | 8,519 €/ha | 8,255 €/ha | 10.12 ha |
| 2022 | 310 | 9,558 €/ha | 8,999 €/ha | 10.71 ha |
| 2023 | 292 | 9,786 €/ha | 9,000 €/ha | 9.30 ha |
| 2024 | 284 | 9,792 €/ha | 8,907 €/ha | 10.41 ha |
| 2025 | 301 | 9,368 €/ha | 8,917 €/ha | 9.85 ha |
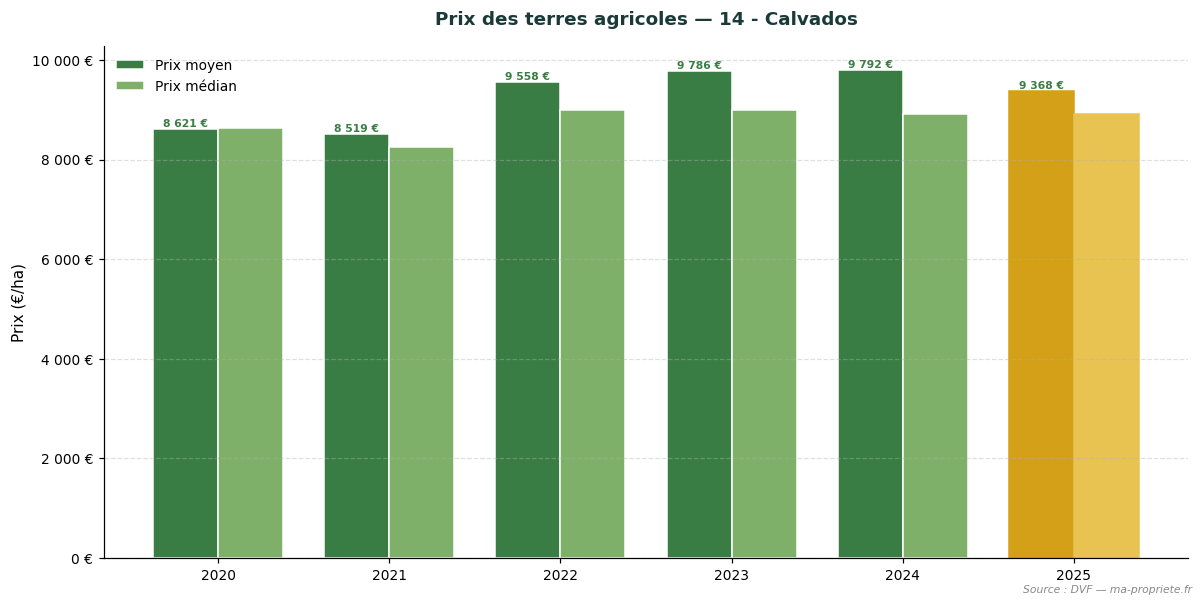
Trend in agricultural land prices — 14 - Calvados. Source: DVF, processed by ma-propriete.fr. The year 2025 is highlighted in golden colour.
The Eure, on the loamy plateaux of the Vexin and Neubourg, displays the highest agronomic potential in the region. In 2025, the average price of agricultural land in the département stands at 10,355 €/ha (+8.9% compared to 2024). The median price reaches 9,723 €/ha, based on 214 recorded transactions (average area 12.02 ha).
| Year | No. of sales | Average price | Median price | Avg. area |
|---|---|---|---|---|
| 2020 | 88 | 8,802 €/ha | 8,473 €/ha | 11.72 ha |
| 2021 | 194 | 9,682 €/ha | 9,064 €/ha | 11.95 ha |
| 2022 | 190 | 9,623 €/ha | 9,000 €/ha | 11.61 ha |
| 2023 | 208 | 9,439 €/ha | 9,000 €/ha | 12.24 ha |
| 2024 | 162 | 9,512 €/ha | 9,000 €/ha | 11.41 ha |
| 2025 | 214 | 10,355 €/ha | 9,723 €/ha | 12.02 ha |
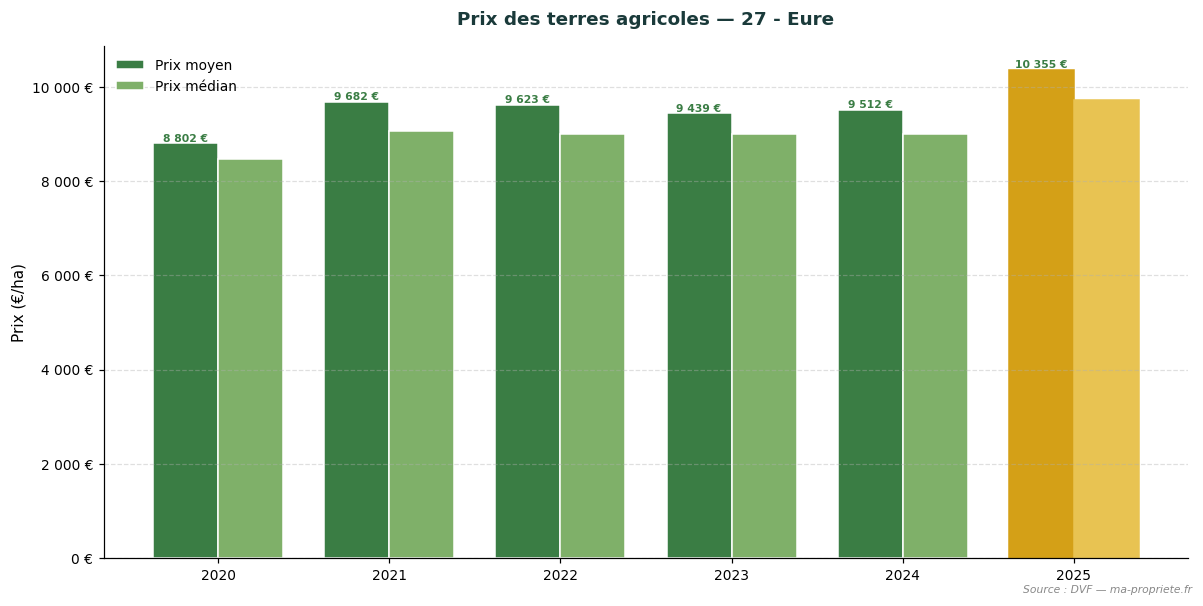
Trend in agricultural land prices — 27 - Eure. Source: DVF, processed by ma-propriete.fr. The year 2025 is highlighted in golden colour.
The Manche is dominated by grassland dairy farming, with a very significant share of permanent pastures. In 2025, the average price of agricultural land in the département stands at 7,788 €/ha (-0.3% compared to 2024). The median price reaches 7,735 €/ha, based on 411 recorded transactions (average area 7.65 ha).
| Year | No. of sales | Average price | Median price | Avg. area |
|---|---|---|---|---|
| 2020 | 241 | 7,417 €/ha | 7,069 €/ha | 7.56 ha |
| 2021 | 430 | 7,357 €/ha | 7,131 €/ha | 6.91 ha |
| 2022 | 400 | 7,518 €/ha | 7,184 €/ha | 8.26 ha |
| 2023 | 416 | 7,642 €/ha | 7,342 €/ha | 7.42 ha |
| 2024 | 456 | 7,809 €/ha | 7,677 €/ha | 7.33 ha |
| 2025 | 411 | 7,788 €/ha | 7,735 €/ha | 7.65 ha |
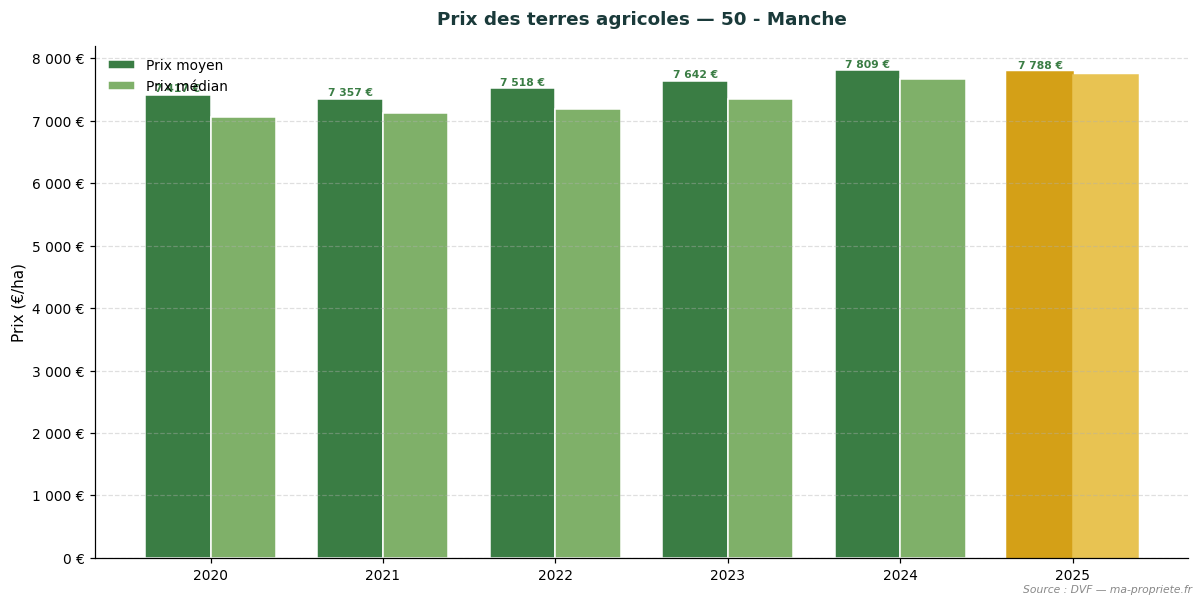
Trend in agricultural land prices — 50 - Manche. Source: DVF, processed by ma-propriete.fr. The year 2025 is highlighted in golden colour.
The Orne combines the bocage of the Perche with the plain of Argentan, with a strong component of suckler and dairy cattle farming. In 2025, the average price of agricultural land in the département stands at 6,818 €/ha (-0.7% compared to 2024). The median price reaches 6,432 €/ha, based on 307 recorded transactions (average area 10.29 ha).
| Year | No. of sales | Average price | Median price | Avg. area |
|---|---|---|---|---|
| 2020 | 161 | 6,601 €/ha | 6,079 €/ha | 8.89 ha |
| 2021 | 346 | 6,665 €/ha | 6,101 €/ha | 8.59 ha |
| 2022 | 361 | 6,739 €/ha | 6,500 €/ha | 9.31 ha |
| 2023 | 352 | 7,185 €/ha | 6,871 €/ha | 9.56 ha |
| 2024 | 336 | 6,866 €/ha | 6,564 €/ha | 10.51 ha |
| 2025 | 307 | 6,818 €/ha | 6,432 €/ha | 10.29 ha |
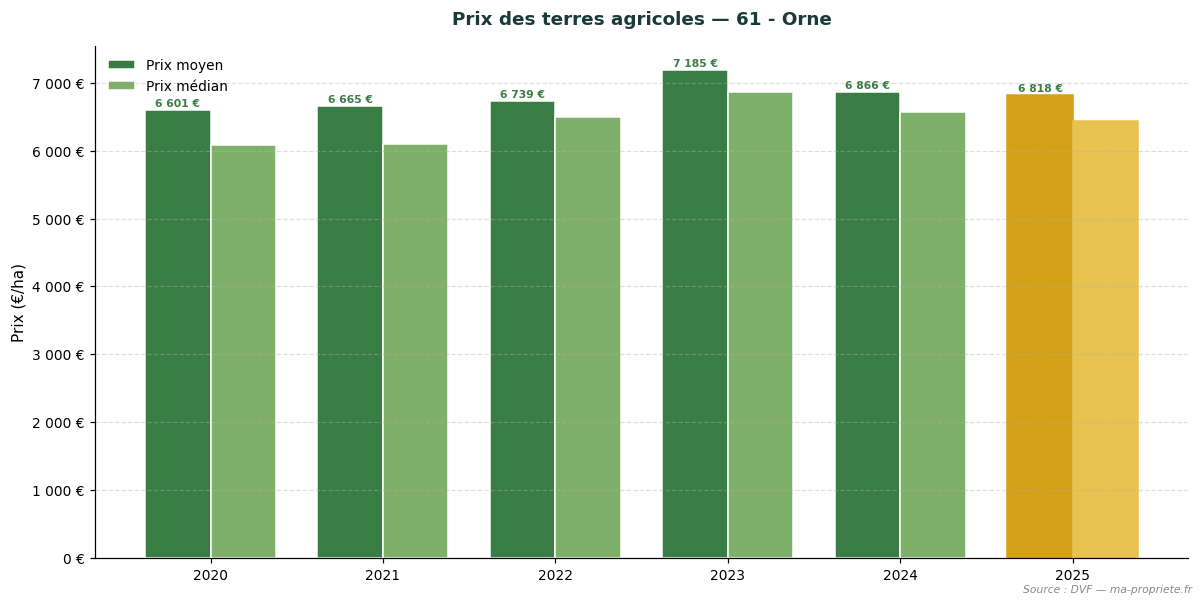
Trend in agricultural land prices — 61 - Orne. Source: DVF, processed by ma-propriete.fr. The year 2025 is highlighted in golden colour.
Seine-Maritime, on the Caux plateaux, displays the highest price levels in Normandy thanks to its exceptional loamy soils. In 2025, the average price of agricultural land in the département stands at 12,013 €/ha (+8.0% compared to 2024). The median price reaches 11,543 €/ha, based on 209 recorded transactions (average area 12.67 ha).
| Year | No. of sales | Average price | Median price | Avg. area |
|---|---|---|---|---|
| 2020 | 106 | 10,128 €/ha | 10,000 €/ha | 8.95 ha |
| 2021 | 212 | 9,975 €/ha | 9,656 €/ha | 11.59 ha |
| 2022 | 223 | 10,877 €/ha | 11,000 €/ha | 10.36 ha |
| 2023 | 243 | 10,655 €/ha | 10,373 €/ha | 10.24 ha |
| 2024 | 220 | 11,126 €/ha | 10,578 €/ha | 9.71 ha |
| 2025 | 209 | 12,013 €/ha | 11,543 €/ha | 12.67 ha |
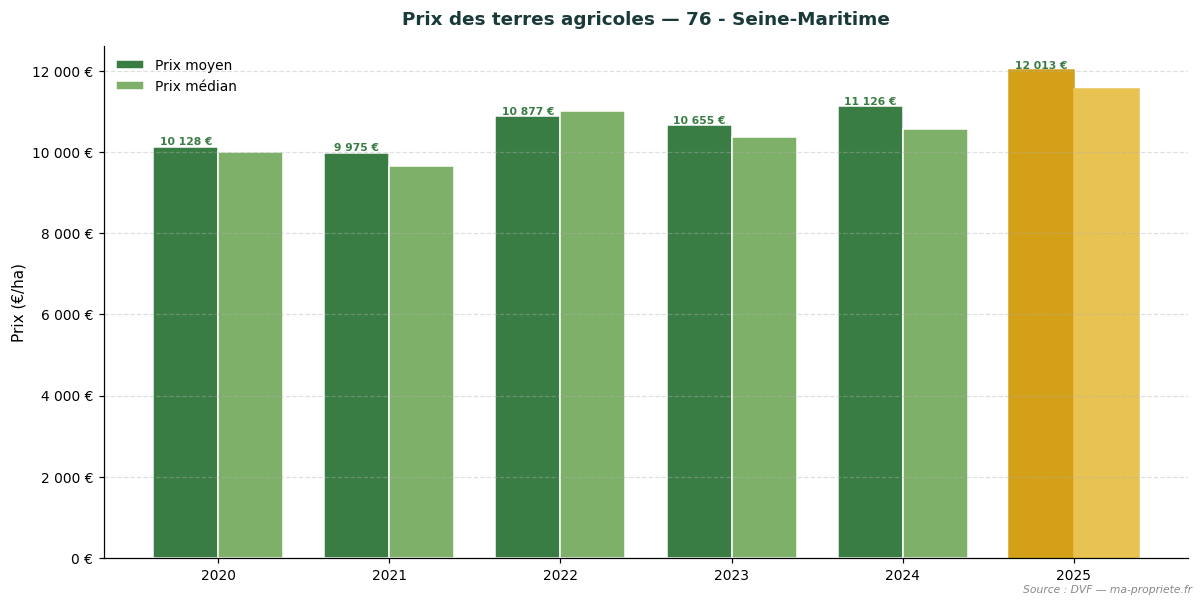
Trend in agricultural land prices — 76 - Seine-Maritime. Source: DVF, processed by ma-propriete.fr. The year 2025 is highlighted in golden colour.
The statistics presented in this article are based on the DVF (Demandes de Valeurs Foncières) database, made available by the Direction générale des finances publiques. This database records all real estate property transfers registered in metropolitan France and the overseas départements. We applied rigorous filtering to retain only transactions corresponding to strictly agricultural plots (arable land, grasslands, specialised crops excluding vineyards), systematically excluding built properties, vineyards and AOC wine estates, as well as mixed sales combining plots and buildings.
For each retained transaction, we calculate the price per hectare by dividing the declared property value by the area of the transferred asset. The regional and departmental statistics then aggregate these unit values: average price, median price, first decile (P10) and ninth decile (P90), average area, and the total number of annual sales.
The use of DVF data calls for several methodological precautions.
The statistics published annually by the SAFER (Sociétés d'aménagement foncier et d'établissement rural) and the Ministry of Agriculture differ from our DVF approach on several points. The SAFER rely on transactions subject to their pre-emption rights or intermediation, which covers only a portion of the market. They also explicitly distinguish between sales of freehold land (not occupied by a tenant farmer) and sales of tenanted land (already under a rural lease), with a structural discount of approximately 18% for the latter.
The DVF approach, more comprehensive in scope, incorporates all recorded transfers without distinction as to tenancy status. This explains why average DVF levels may differ from SAFER publications, particularly in regions where the weight of tenanted sales is significant. We present both series in parallel to offer the most complete possible view of the agricultural land market.
The year 2025 confirms the stability of the agricultural land market in Normandy as a whole, with a regional average price of 8,905 €/ha (+2.7% vs 2024). Behind this average, the region's 5 départements display differentiated dynamics that reflect the diversity of terroirs and productive orientations. The maritime départements (Seine-Maritime, Eure, Calvados) pull the regional average upward thanks to soils with high agronomic potential. The Manche and Orne, more focused on grassland farming, maintain a more moderate market.
To regularly monitor the evolution of the agricultural land market, consult the agricultural land price observatory at ma-propriete.fr, as well as the agricultural section and the agricultural listings published on our portal.
To explore the French agricultural land market in greater depth, find our articles dedicated to each region.