Updated May 7, 2026: Find the most recent data on our Agricultural Land Price Observatory (DVF data 2020-2025), which presents average prices, median prices and transaction ranges for your region and each department.
Summary of the main DVF statistics for 2025, now available in full. The figures below cover exclusively agricultural land excluding vineyards (arable crops, grasslands, ploughed land, specialised crops).
| Key figures 2025 — Île-de-France | |
|---|---|
| Average price | €7,932/ha |
| Median price | €7,465/ha |
| First decile (P10) | €5,253/ha |
| Ninth decile (P90) | €10,940/ha |
| Number of sales | 214 |
| Average area | 15.38 ha |
| Change vs 2024 | +0.5% |
Île-de-France maintains, despite urban pressure, a dense agricultural activity dominated by large-scale cereal crops (wheat, barley, rapeseed, sugar beet) on the plateaux of Brie, Vexin and Beauce. Nearly 50% of the Île-de-France territory remains devoted to agriculture, representing approximately 569,000 hectares of utilised agricultural area. The region's main agricultural orientations — large-scale cereal and oilseed crops, sugar beet, open-field vegetables, marginal mixed farming, specialised horticulture (watercress, strawberries, aromatic plants) — shape a land market whose levels and dynamics differ considerably from one department to another.
This article presents agricultural land prices in Île-de-France based on DVF (Demandes de Valeurs Foncières) data processed by ma-propriete.fr, supplemented by publications from the Ministry of Agriculture sourced from the SAFER networks. The year 2025, now available in full, is the primary focus; 2024 serves as the comparative reference.
In 2025, the average price of agricultural land in Île-de-France stands at €7,932/ha, representing a change of +0.5% compared to 2024. The median price, a less sensitive indicator to extreme transactions, reaches €7,465/ha. Over the full year, 214 transactions were recorded in the region with an average area per sale of 15.38 ha.
The gap between the first decile (€5,253/ha) and the ninth decile (€10,940/ha) — a P90/P10 ratio of 2.1 — illustrates the dispersion of prices within the region. This dispersion reflects the heterogeneity of terroirs, the diversity of productive orientations and the variability of land pressure across zones.
Over the 2021–2025 period (the first years fully covered by DVF), the regional average price has risen (+5.2%).
| Year | Number of sales | Average price | Median price | P10 | P90 | Average area |
|---|---|---|---|---|---|---|
| 2020 | 112 | €8,008/ha | €7,155/ha | €5,000/ha | €11,991/ha | 17.65 ha |
| 2021 | 243 | €7,540/ha | €6,759/ha | €4,904/ha | €11,565/ha | 14.53 ha |
| 2022 | 237 | €7,968/ha | €7,393/ha | €5,000/ha | €11,589/ha | 14.45 ha |
| 2023 | 239 | €7,737/ha | €7,085/ha | €5,151/ha | €10,857/ha | 13.33 ha |
| 2024 | 228 | €7,895/ha | €7,004/ha | €5,000/ha | €11,205/ha | 18.53 ha |
| 2025 | 214 | €7,932/ha | €7,465/ha | €5,253/ha | €10,940/ha | 15.38 ha |
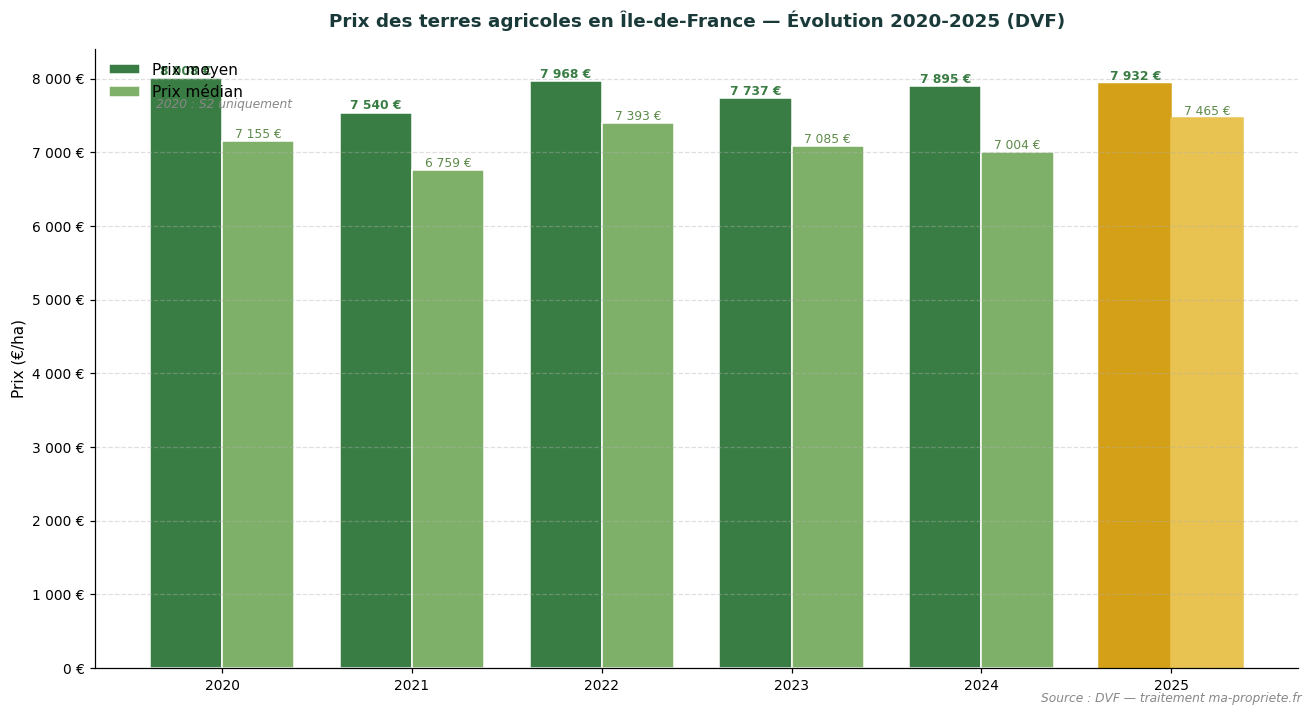
Change in average and median agricultural land prices in Île-de-France (2020–2025). Source: DVF, processed by ma-propriete.fr. The year 2025 is highlighted in gold.
The SAFER networks publish an annual summary of agricultural land prices, distinguishing sales of vacant land (plots not occupied by a tenant farmer) from sales of tenanted land (plots already under a rural lease). In Île-de-France, the latest available year is 2024: the average price of vacant land reaches €7,750/ha, compared with €6,660/ha for tenanted land. In 2024, the gap between vacant and tenanted land stands at 14% in Île-de-France, close to the national average (~18%).
| Year | Vacant land (SAFER) | Tenanted land (SAFER) |
|---|---|---|
| 2015 | €7,620/ha | €5,750/ha |
| 2018 | €8,730/ha | €6,060/ha |
| 2020 | €7,490/ha | €6,640/ha |
| 2022 | €7,690/ha | €6,640/ha |
| 2023 | €7,580/ha | €6,640/ha |
| 2024 | €7,750/ha | €6,660/ha |
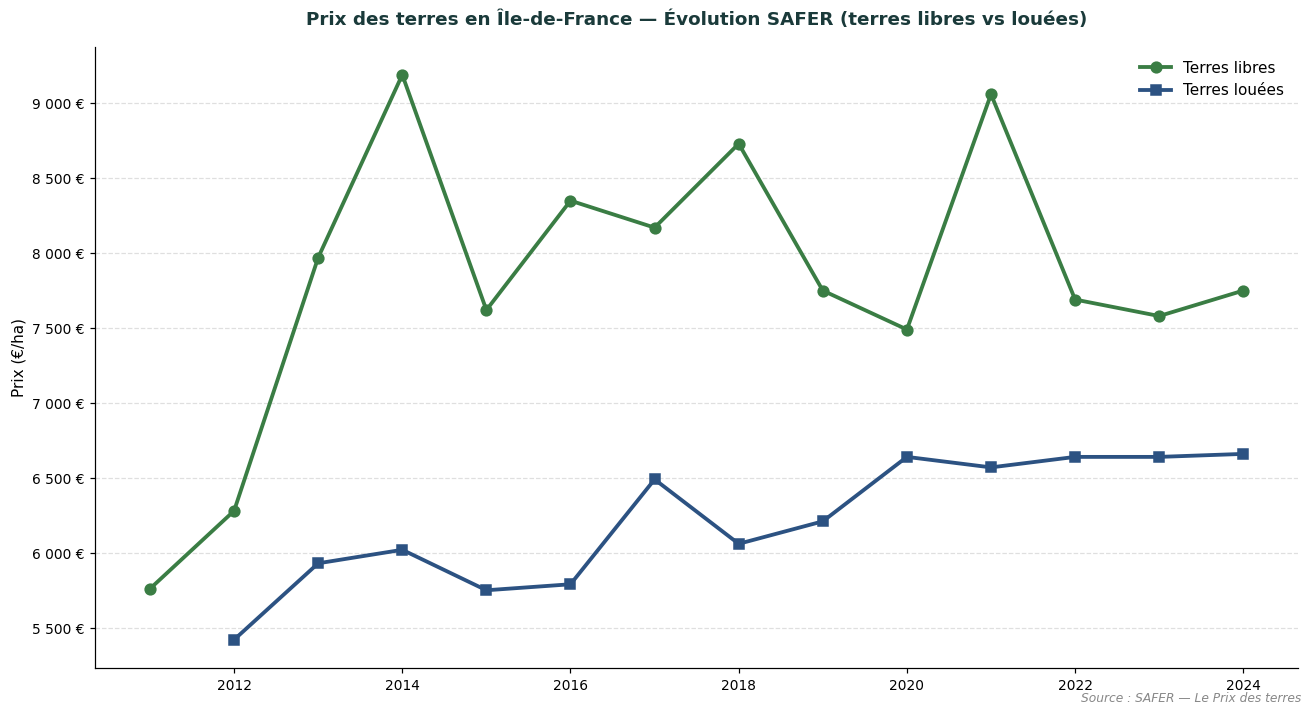
Comparative trend in vacant and tenanted land prices in Île-de-France. Source: SAFER — Le Prix des terres.
SAFER figures are not directly comparable to the DVF figures presented above: SAFER only covers a portion of the market (transactions subject to pre-emption rights or SAFER intermediation), whereas DVF captures all recorded transfers. The two sources are complementary and allow the land market to be assessed from two distinct angles.
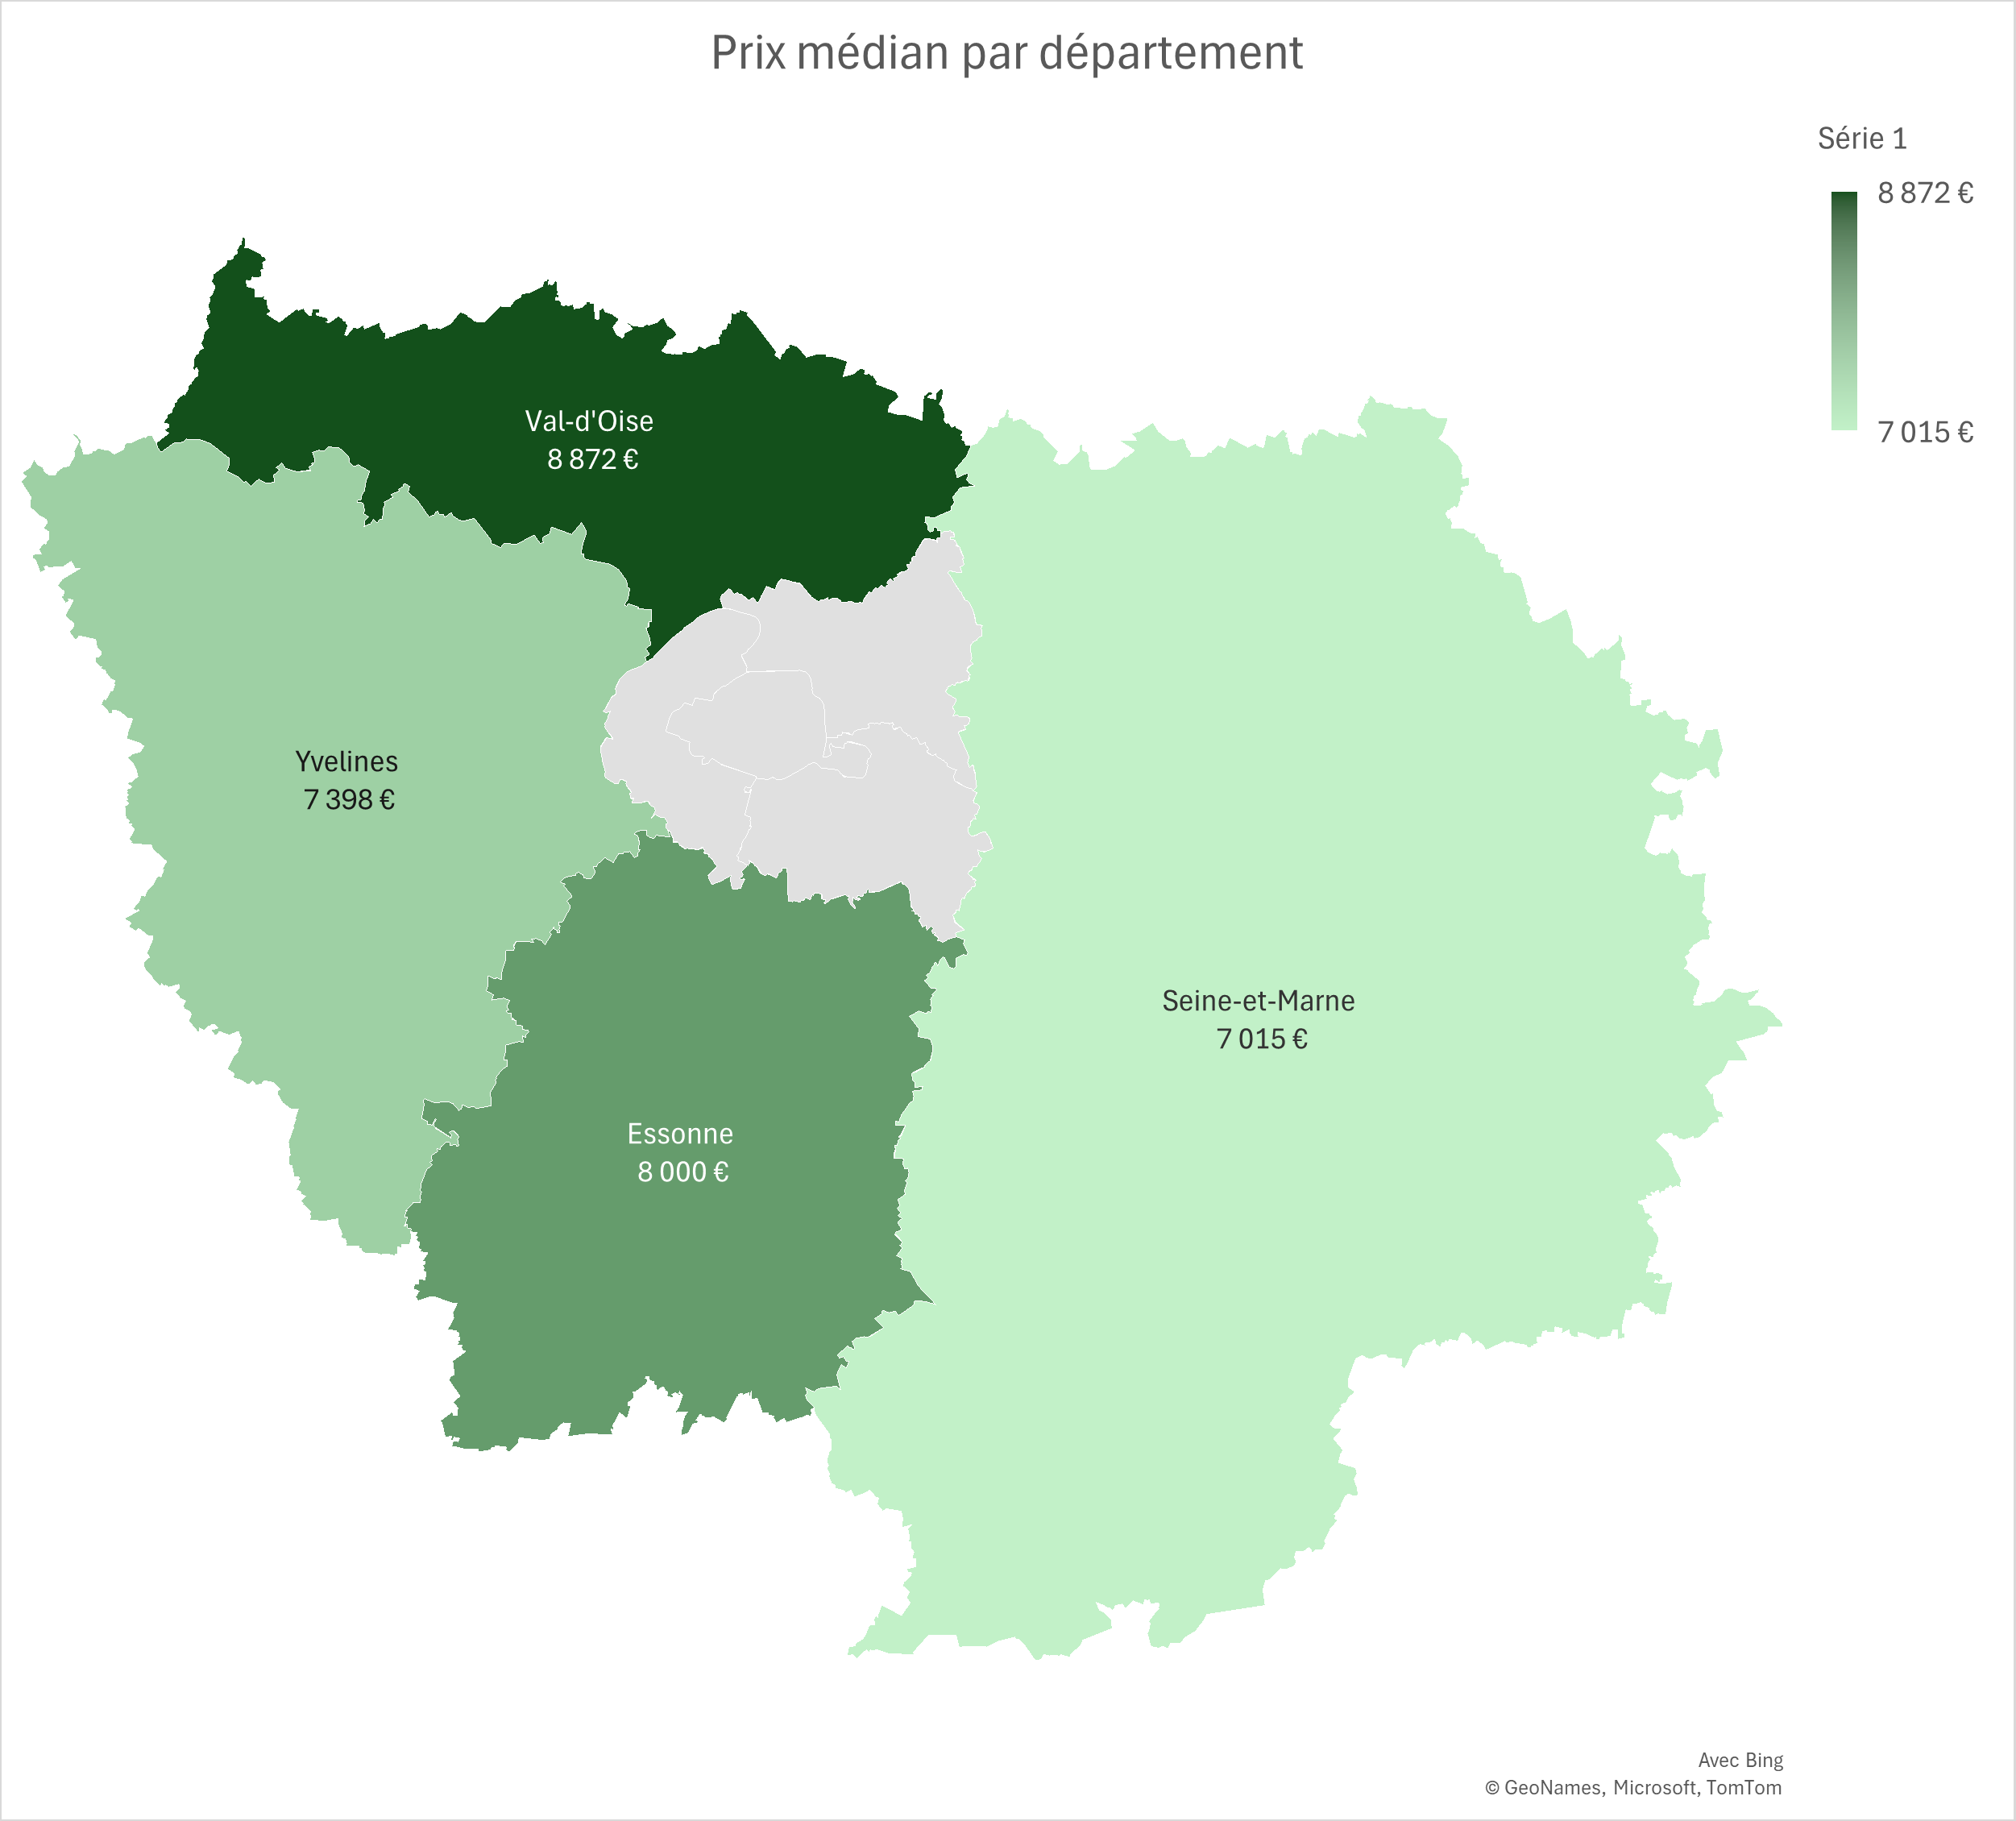
Seine-et-Marne, the leading agricultural department in Île-de-France, concentrates the Brie plateaux devoted to large-scale cereal crops. In 2025, the average price of agricultural land in the department stands at €7,828/ha (+8.1% compared to 2024). The median price reaches €7,015/ha, based on 126 recorded transactions (average area 16.36 ha).
| Year | No. of sales | Average price | Median price | Avg. area |
|---|---|---|---|---|
| 2020 | 59 | €7,966/ha | €7,000/ha | 21.63 ha |
| 2021 | 149 | €7,354/ha | €6,500/ha | 14.62 ha |
| 2022 | 143 | €7,511/ha | €7,110/ha | 16.00 ha |
| 2023 | 145 | €7,874/ha | €7,000/ha | 15.72 ha |
| 2024 | 144 | €7,240/ha | €6,881/ha | 17.28 ha |
| 2025 | 126 | €7,828/ha | €7,015/ha | 16.36 ha |
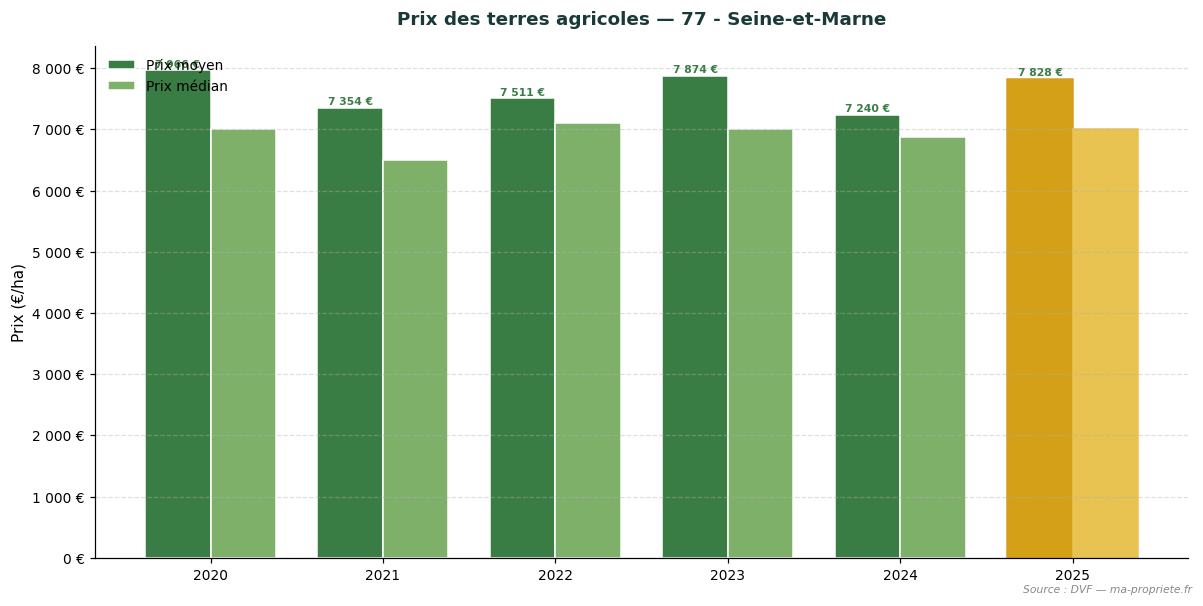
Change in agricultural land prices — 77 - Seine-et-Marne. Source: DVF, processed by ma-propriete.fr. The year 2025 is highlighted in gold.
Yvelines combines large-scale crops on the Versailles plain with peri-urban areas subject to strong land pressure. In 2025, the average price of agricultural land in the department stands at €7,365/ha (-24.1% compared to 2024). The median price reaches €7,398/ha, based on 36 recorded transactions (average area 13.36 ha).
| Year | No. of sales | Average price | Median price | Avg. area |
|---|---|---|---|---|
| 2020 | 25 | €8,013/ha | €6,714/ha | 14.86 ha |
| 2021 | 36 | €7,387/ha | €6,855/ha | 14.97 ha |
| 2022 | 42 | €8,797/ha | €7,760/ha | 12.94 ha |
| 2023 | 25 | €6,722/ha | €6,960/ha | 8.84 ha |
| 2024 | 37 | €9,707/ha | €7,721/ha | 21.22 ha |
| 2025 | 36 | €7,365/ha | €7,398/ha | 13.36 ha |
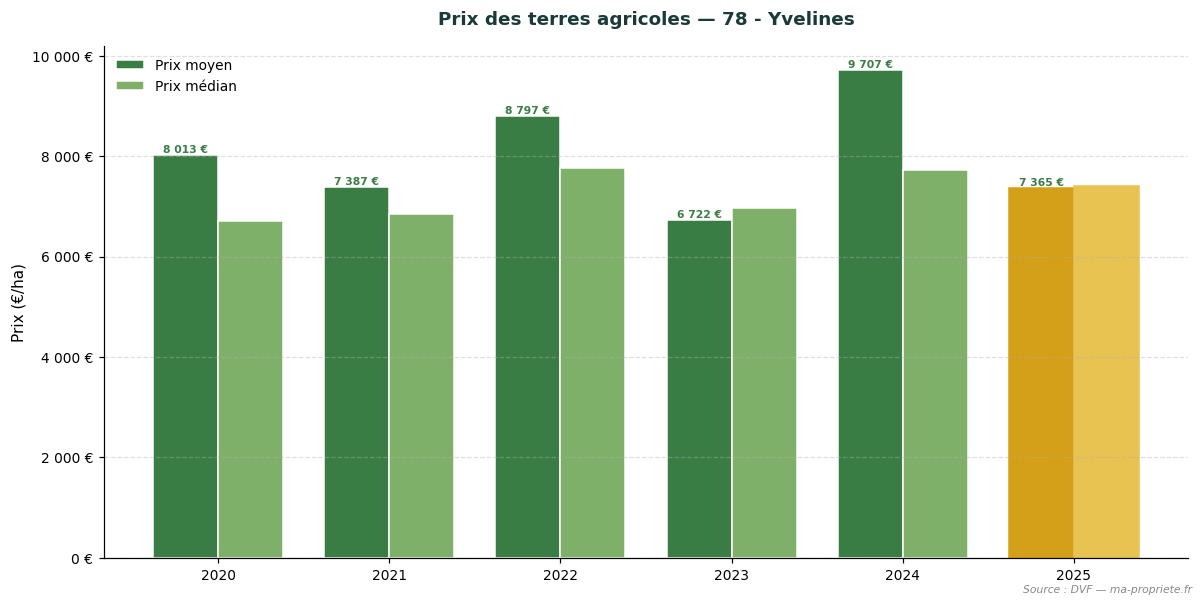
Change in agricultural land prices — 78 - Yvelines. Source: DVF, processed by ma-propriete.fr. The year 2025 is highlighted in gold.
Essonne combines the southern Beauce plateaux with urban development fronts that make it one of the departments with the highest land pressure. In 2025, the average price of agricultural land in the department stands at €8,011/ha (+4.4% compared to 2024). The median price reaches €8,000/ha, based on 32 recorded transactions (average area 15.39 ha).
| Year | No. of sales | Average price | Median price | Avg. area |
|---|---|---|---|---|
| 2020 | 17 | €7,639/ha | €7,185/ha | 10.81 ha |
| 2021 | 37 | €8,085/ha | €6,700/ha | 10.94 ha |
| 2022 | 31 | €8,659/ha | €8,600/ha | 13.15 ha |
| 2023 | 39 | €7,613/ha | €7,300/ha | 8.51 ha |
| 2024 | 25 | €7,674/ha | €7,524/ha | 23.16 ha |
| 2025 | 32 | €8,011/ha | €8,000/ha | 15.39 ha |
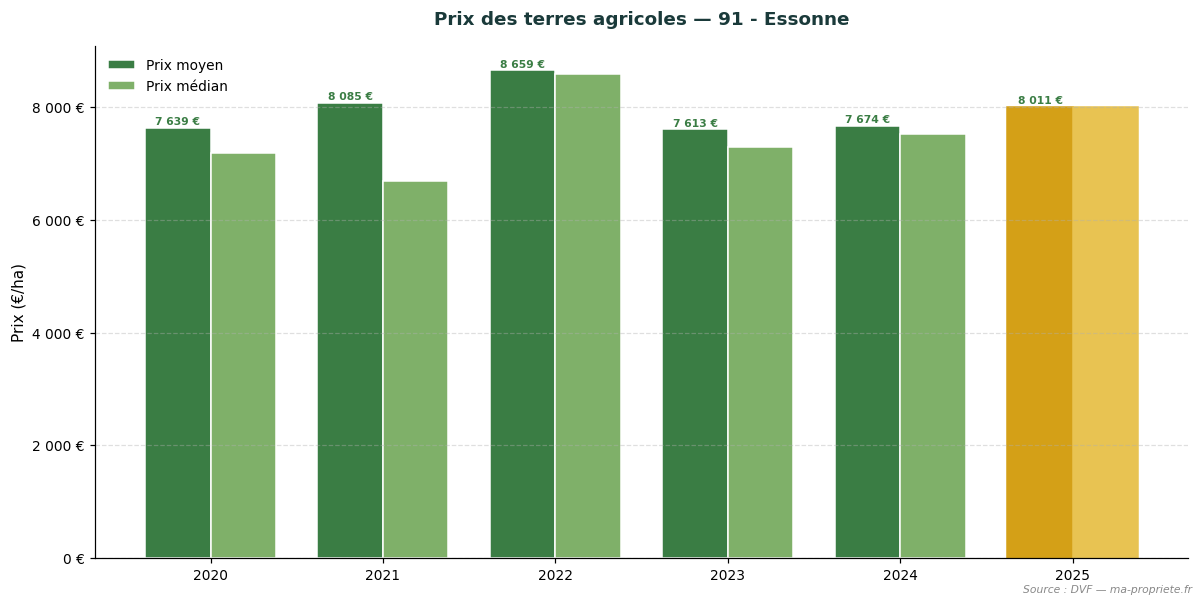
Change in agricultural land prices — 91 - Essonne. Source: DVF, processed by ma-propriete.fr. The year 2025 is highlighted in gold.
Val-d'Oise, on the Vexin plateau, remains strongly cereal-oriented, but with a limited number of transactions each year. In 2025, the average price of agricultural land in the department stands at €9,484/ha (+1.0% compared to 2024). The median price reaches €8,872/ha, based on 20 recorded transactions (average area 12.86 ha). The low number of transactions (fewer than 30 sales) calls for caution when interpreting annual averages.
| Year | No. of sales | Average price | Median price | Avg. area |
|---|---|---|---|---|
| 2020 | 11 | €8,792/ha | €8,317/ha | 13.23 ha |
| 2021 | 21 | €8,168/ha | €7,917/ha | 19.50 ha |
| 2022 | 21 | €8,396/ha | €8,159/ha | 8.80 ha |
| 2023 | 30 | €8,086/ha | €7,901/ha | 11.77 ha |
| 2024 | 22 | €9,388/ha | €8,110/ha | 16.93 ha |
| 2025 | 20 | €9,484/ha | €8,872/ha | 12.86 ha |
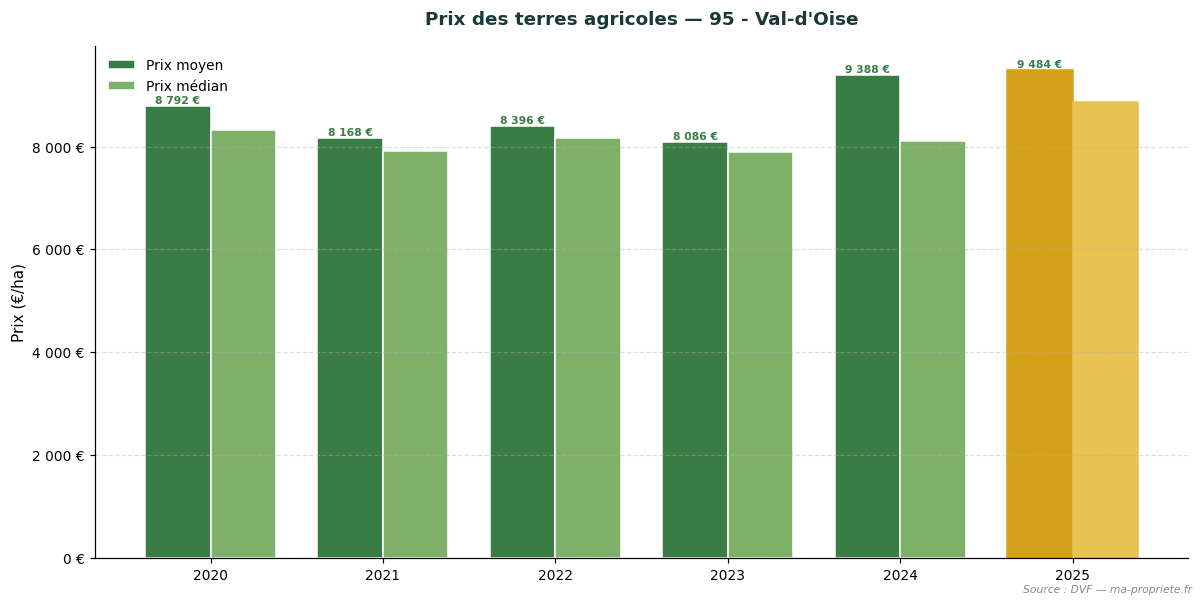
Change in agricultural land prices — 95 - Val-d'Oise. Source: DVF, processed by ma-propriete.fr. The year 2025 is highlighted in gold.
The statistics presented in this article are based on the DVF (Demandes de Valeurs Foncières) database, published by the Directorate General of Public Finances. This database records all real estate property transfers registered in metropolitan France and the overseas departments. We applied rigorous filtering to retain only transactions corresponding to strictly agricultural plots (arable land, grasslands, specialised crops excluding vineyards), systematically excluding built properties, vineyards and AOC wine estates, as well as mixed sales combining plots and buildings.
For each retained transaction, we calculate the price per hectare by dividing the declared property value by the area of the transferred asset. Regional and departmental statistics then aggregate these unit values: average price, median price, first decile (P10) and ninth decile (P90), average area, and total number of annual sales.
The use of DVF data requires several methodological precautions.
The statistics published annually by the SAFER networks (Sociétés d'aménagement foncier et d'établissement rural) and the Ministry of Agriculture differ from our DVF approach in several respects. The SAFER networks base their figures on transactions subject to their pre-emption rights or intermediation, which covers only a portion of the market. They also explicitly distinguish sales of vacant land (not occupied by a tenant farmer) from sales of tenanted land (already under a rural lease), with a structural discount of approximately 18% for the latter.
The DVF approach, being more comprehensive, incorporates all recorded transfers without distinction as to tenancy status. This explains why average DVF levels may differ from SAFER publications, particularly in regions where the proportion of tenanted sales is significant. We present both series in parallel to offer the most complete possible view of the agricultural land market.
The year 2025 confirms the stability of the agricultural land market in Île-de-France as a whole, with a regional average price of €7,932/ha (+0.5% vs 2024). Behind this average, the region's 4 departments display differentiated dynamics reflecting the diversity of terroirs and productive orientations. Peri-urban land pressure and speculation surrounding Grand Paris projects weigh heavily on land values. The departments of Seine-et-Marne and Essonne account for the bulk of transactions, while Yvelines and Val-d'Oise display prices pushed upward by the scarcity of supply.
To regularly monitor changes in the agricultural land market, consult the agricultural land price observatory on ma-propriete.fr, as well as the agricultural section and the agricultural listings published on our portal.
To deepen your analysis of the French agricultural land market, explore our articles dedicated to each region.