Updated May 7, 2026: Find the latest data in our Agricultural Land Price Observatory (DVF data 2020-2025), which presents average prices, median prices and transaction ranges for your region and each department.
Summary of the main DVF statistics for the year 2025, now fully available. The figures below relate exclusively to agricultural land excluding vineyards (arable crops, grasslands, tillable land, specialised crops).
| Key figures 2025 — Grand Est | |
|---|---|
| Average price | €7,490/ha |
| Median price | €5,611/ha |
| First decile (P10) | €3,151/ha |
| Ninth decile (P90) | €14,830/ha |
| Number of sales | 1,233 |
| Average area | 11.90 ha |
| Change vs 2024 | +4.7% |
Grand Est combines arable basins of European significance (Champagne crayeuse, Marne plain) with livestock farming areas (Vosges, Ardennes, Argonne). The regional UAA exceeds 1.5 million hectares excluding Alsace-Moselle. The main regional agricultural activities — arable crops (wheat, barley, rapeseed), dairy and beef cattle farming, industrial crops (sugar beet, potato) — shape a land market whose levels and dynamics vary greatly from one department to another.
This article presents agricultural land prices in Grand Est based on DVF data (Demandes de Valeurs Foncières) processed by ma-propriete.fr, supplemented by Ministry of Agriculture publications from the SAFERs. The year 2025, now fully available, is the primary focus; 2024 serves as a comparative reference. The Champagne and Alsatian vineyard areas constitute a specific market expressly excluded from the scope of this article.
In 2025, the average price of agricultural land in Grand Est stands at €7,490/ha, representing a change of +4.7% compared to 2024. The median price, a less sensitive indicator to extreme transactions, reaches €5,611/ha. Over the full year, 1,233 transactions were recorded in the region with an average area per sale of 11.90 ha.
The gap between the first decile (€3,151/ha) and the ninth decile (€14,830/ha) — a P90/P10 ratio of 4.7 — illustrates the price dispersion within the region. This dispersion reflects the heterogeneity of terroirs, the diversity of production activities and the variability of land pressure across different areas.
Over the 2021–2025 period (the first years fully covered by DVF), the regional average price has risen (+3.2%).
| Year | Number of sales | Average price | Median price | P10 | P90 | Average area |
|---|---|---|---|---|---|---|
| 2020 | 652 | €7,257/ha | €5,583/ha | €3,000/ha | €14,000/ha | 11.21 ha |
| 2021 | 1,320 | €7,259/ha | €5,694/ha | €3,060/ha | €14,000/ha | 11.33 ha |
| 2022 | 1,260 | €6,874/ha | €5,252/ha | €3,059/ha | €13,000/ha | 11.65 ha |
| 2023 | 1,309 | €7,221/ha | €5,600/ha | €3,208/ha | €14,000/ha | 11.69 ha |
| 2024 | 1,176 | €7,157/ha | €5,602/ha | €3,082/ha | €13,955/ha | 11.35 ha |
| 2025 | 1,233 | €7,490/ha | €5,611/ha | €3,151/ha | €14,830/ha | 11.90 ha |
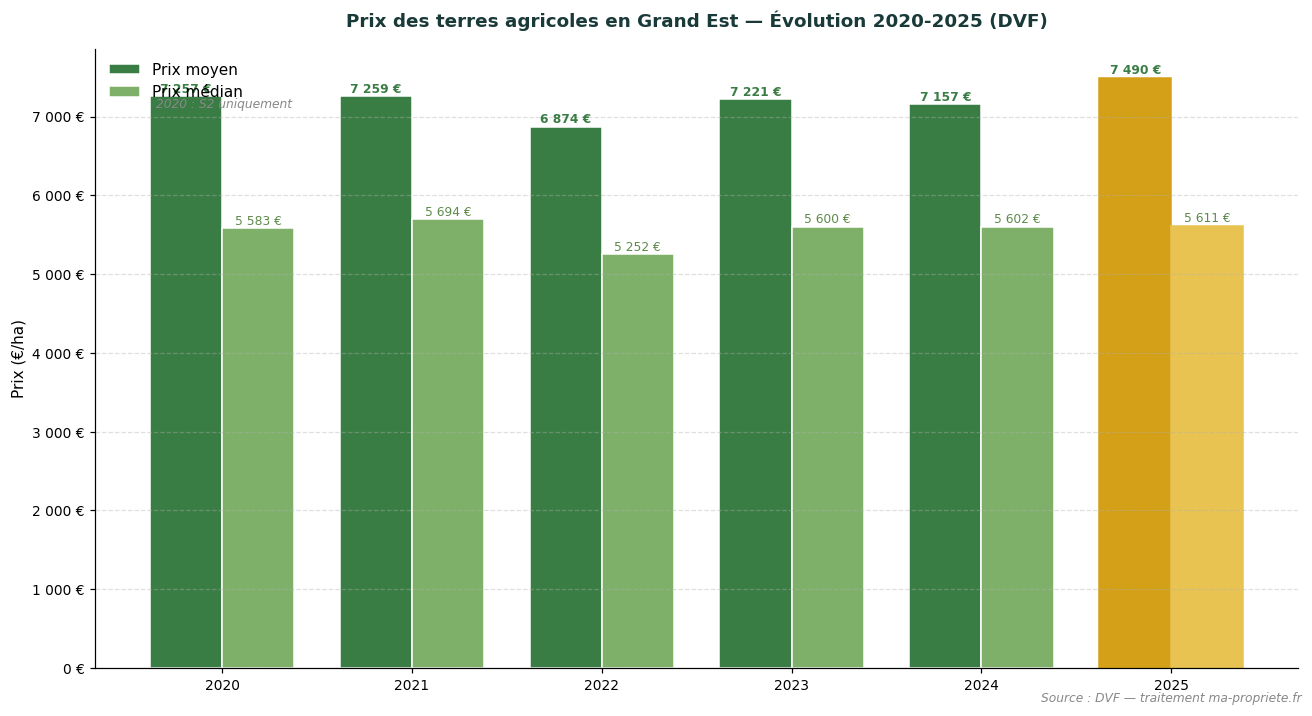
Trend in average and median agricultural land prices in Grand Est (2020–2025). Source: DVF, processed by ma-propriete.fr. The year 2025 is highlighted in gold.
The SAFERs publish an annual summary of agricultural land prices, distinguishing between sales of vacant land (parcels not occupied by a tenant farmer) and sales of tenanted land (parcels already under a rural lease). In Grand Est, the latest available year is 2024: the average price for vacant land reaches €6,810/ha, compared to €6,620/ha for tenanted land. In 2024, the gap between vacant and tenanted land stands at 3% in Grand Est, below the national average (~18%).
| Year | Vacant land (SAFER) | Tenanted land (SAFER) |
|---|---|---|
| 2015 | €6,510/ha | €6,220/ha |
| 2018 | €6,440/ha | €6,330/ha |
| 2020 | €6,450/ha | €6,580/ha |
| 2022 | €6,390/ha | €6,720/ha |
| 2023 | €6,350/ha | €6,500/ha |
| 2024 | €6,810/ha | €6,620/ha |
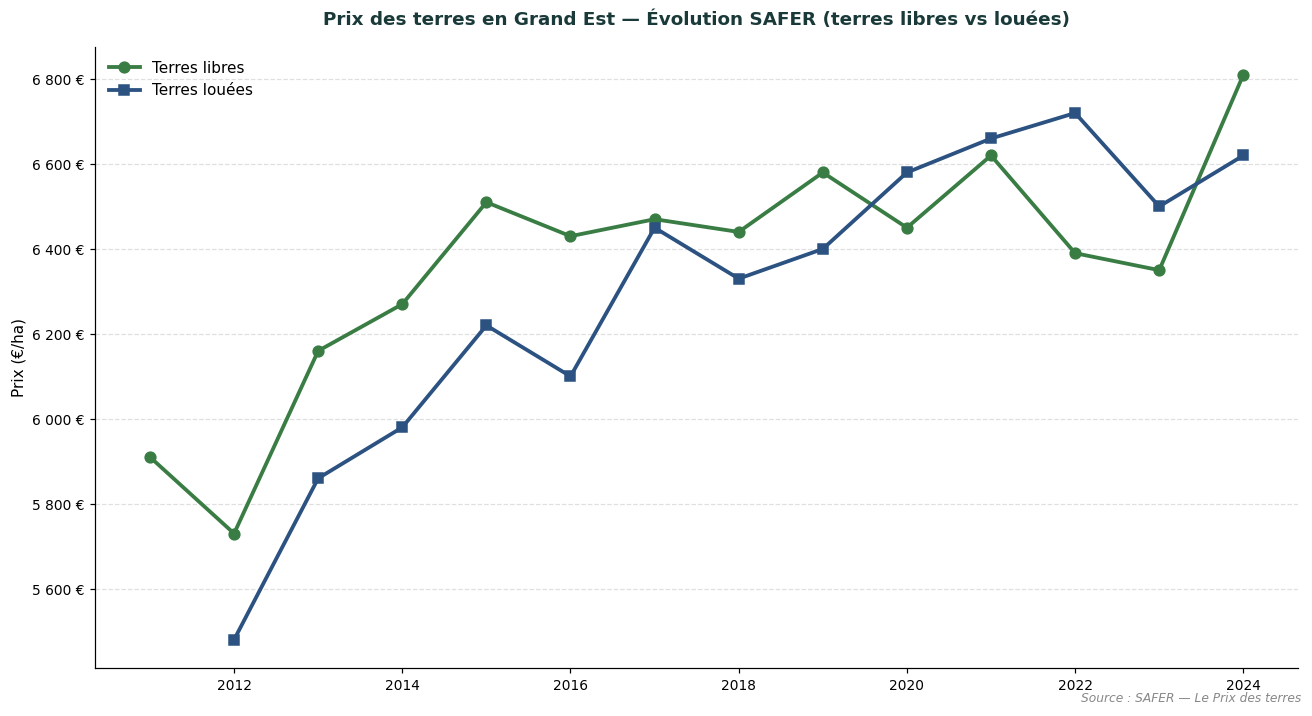
Comparative trend in vacant and tenanted land prices in Grand Est. Source: SAFER — Le Prix des terres.
SAFER figures cannot be directly compared to the DVF figures presented above: SAFER only covers part of the market (transactions subject to pre-emption rights or intermediation), whereas DVF captures all registered property transfers. The two sources are complementary and allow the land market to be assessed from two distinct angles.
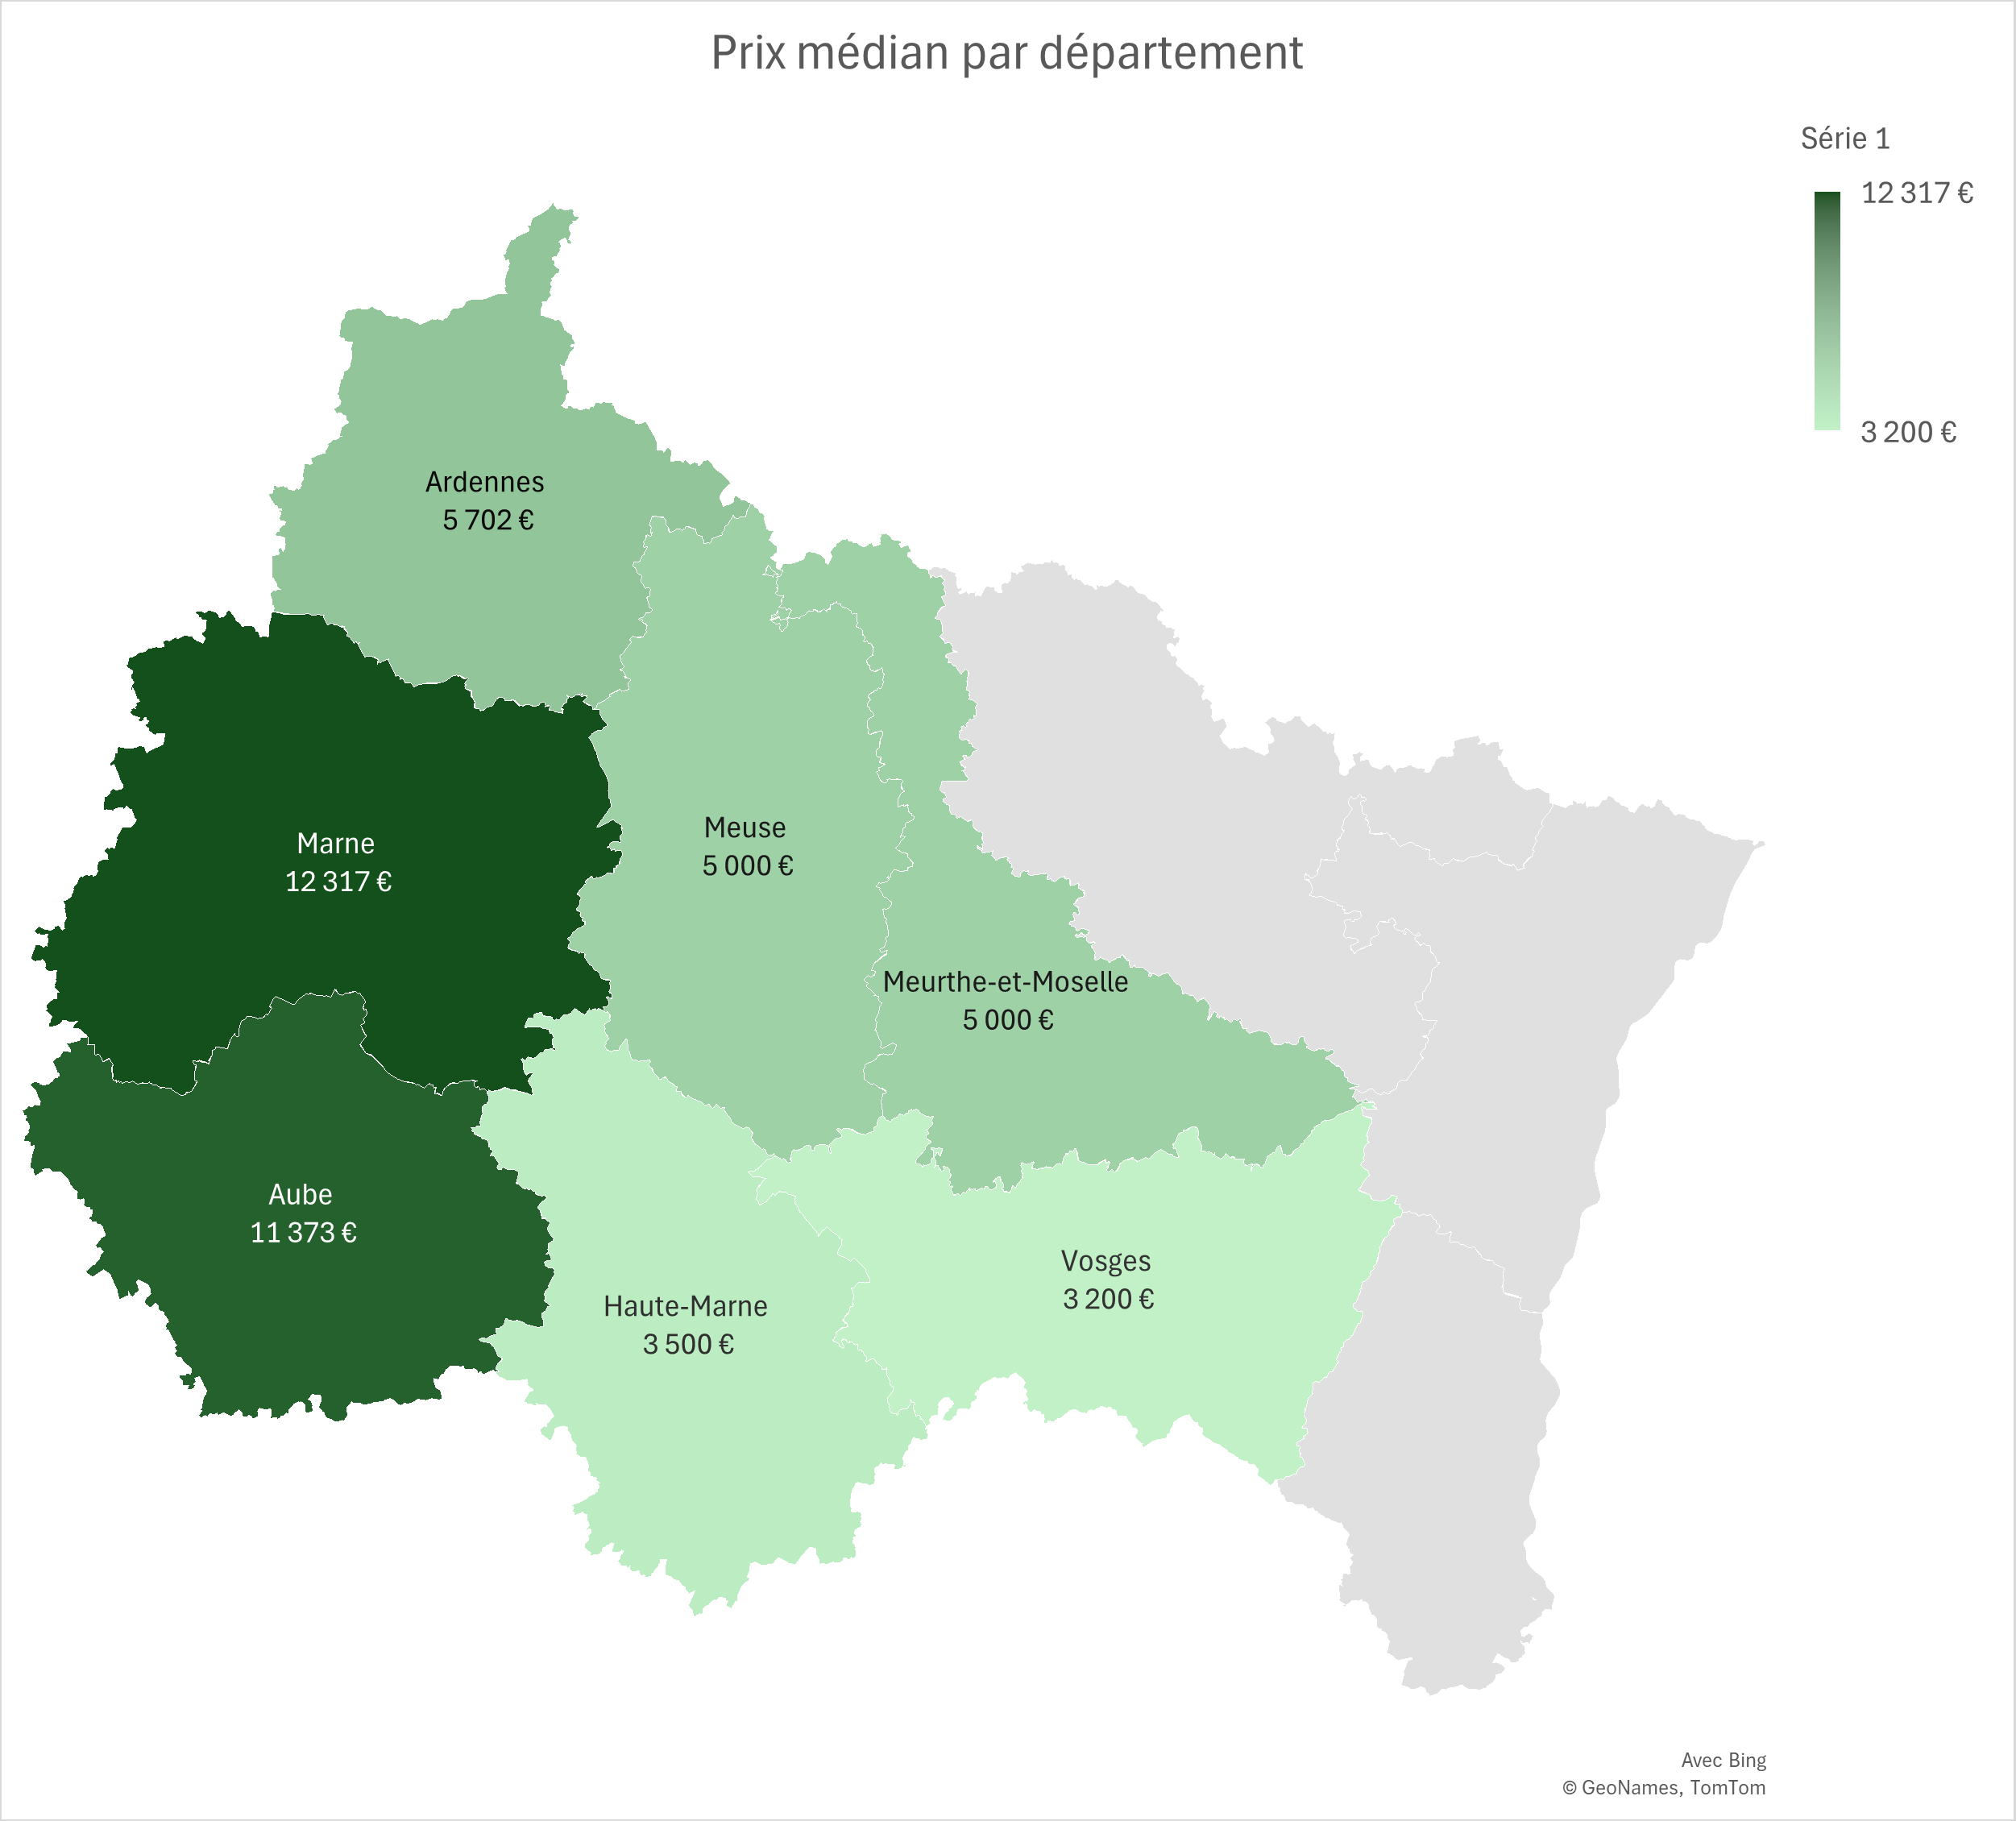
The Ardennes combines arable farming in the lowlands with beef cattle farming in the massif. In 2025, the average price of agricultural land in the department stands at €7,559/ha (+2.7% compared to 2024). The median price reaches €5,702/ha, based on 209 recorded transactions (average area 11.45 ha).
| Year | No. of sales | Average price | Median price | Avg. area |
|---|---|---|---|---|
| 2020 | 91 | €7,310/ha | €5,520/ha | 11.49 ha |
| 2021 | 199 | €6,462/ha | €5,200/ha | 12.02 ha |
| 2022 | 179 | €6,857/ha | €5,911/ha | 11.65 ha |
| 2023 | 216 | €6,614/ha | €5,474/ha | 10.95 ha |
| 2024 | 183 | €7,358/ha | €5,994/ha | 10.36 ha |
| 2025 | 209 | €7,559/ha | €5,702/ha | 11.45 ha |
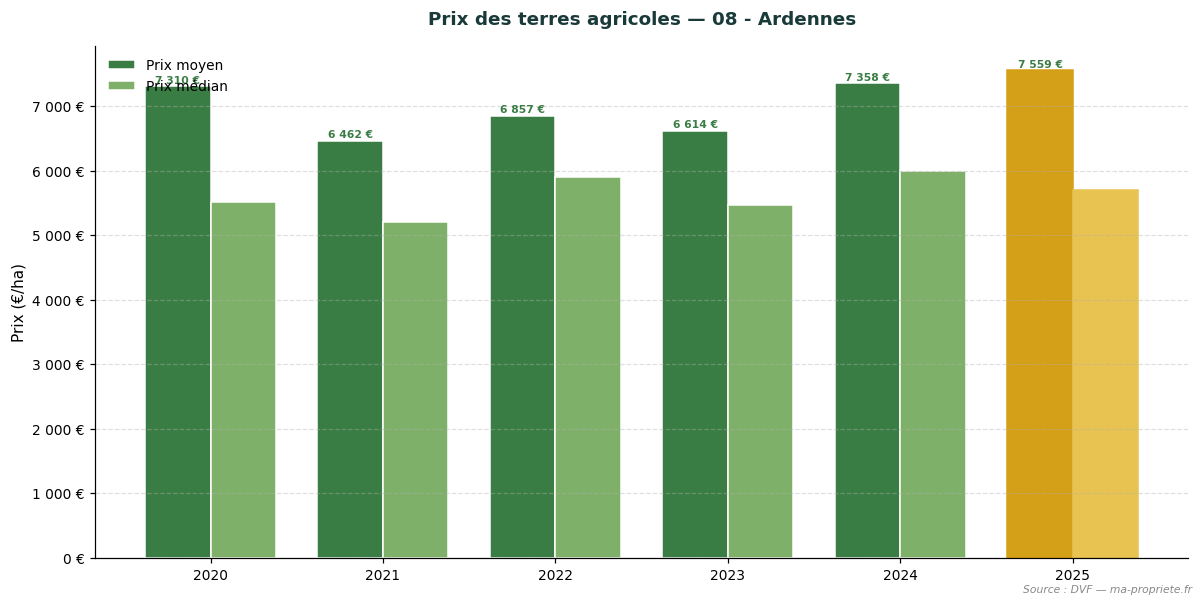
Trend in agricultural land prices — 08 - Ardennes. Source: DVF, processed by ma-propriete.fr. The year 2025 is highlighted in gold.
Aube, situated on the Champagne crayeuse, is dominated by arable farming and has one of the most expensive markets in the region. In 2025, the average price of agricultural land in the department stands at €10,929/ha (+9.8% compared to 2024). The median price reaches €11,373/ha, based on 179 recorded transactions (average area 12.16 ha).
| Year | No. of sales | Average price | Median price | Avg. area |
|---|---|---|---|---|
| 2020 | 101 | €9,925/ha | €9,500/ha | 11.90 ha |
| 2021 | 207 | €10,503/ha | €10,011/ha | 12.21 ha |
| 2022 | 187 | €9,785/ha | €9,800/ha | 11.75 ha |
| 2023 | 239 | €10,058/ha | €10,000/ha | 11.82 ha |
| 2024 | 166 | €9,951/ha | €9,596/ha | 12.76 ha |
| 2025 | 179 | €10,929/ha | €11,373/ha | 12.16 ha |
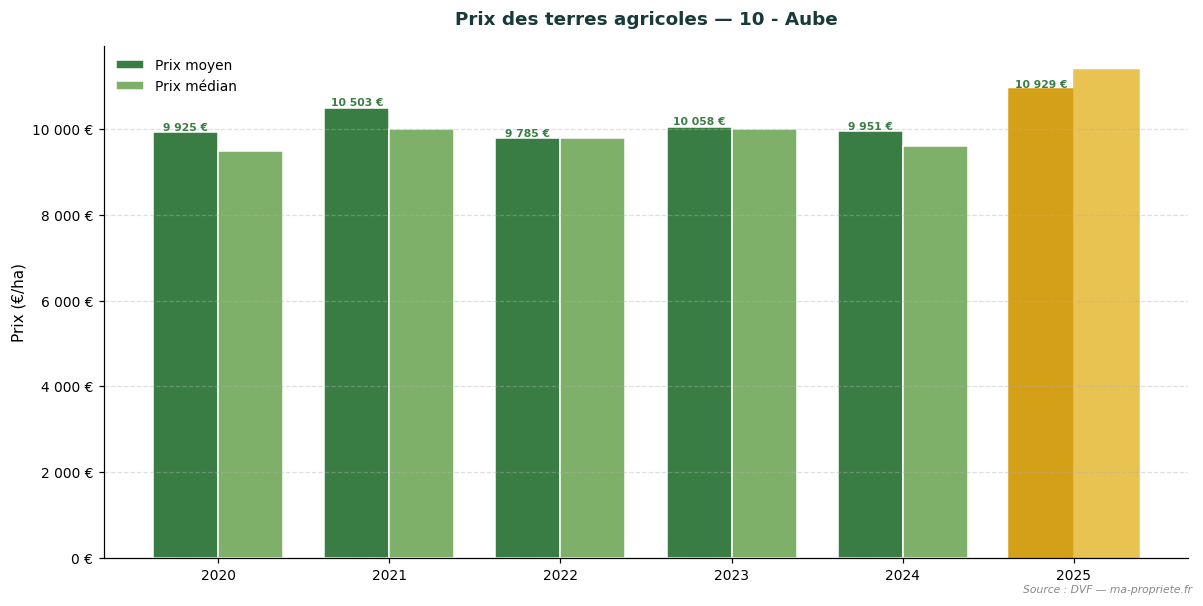
Trend in agricultural land prices — 10 - Aube. Source: DVF, processed by ma-propriete.fr. The year 2025 is highlighted in gold.
Marne (excluding the Champagne wine zone) remains arable on the Champagne crayeuse, with very high prices driven by agronomic value. In 2025, the average price of agricultural land in the department stands at €11,957/ha (+6.1% compared to 2024). The median price reaches €12,317/ha, based on 254 recorded transactions (average area 13.43 ha).
| Year | No. of sales | Average price | Median price | Avg. area |
|---|---|---|---|---|
| 2020 | 158 | €11,483/ha | €11,985/ha | 10.78 ha |
| 2021 | 307 | €11,505/ha | €11,927/ha | 12.30 ha |
| 2022 | 264 | €11,238/ha | €12,000/ha | 13.41 ha |
| 2023 | 255 | €11,577/ha | €12,000/ha | 14.54 ha |
| 2024 | 254 | €11,267/ha | €11,368/ha | 11.28 ha |
| 2025 | 254 | €11,957/ha | €12,317/ha | 13.43 ha |
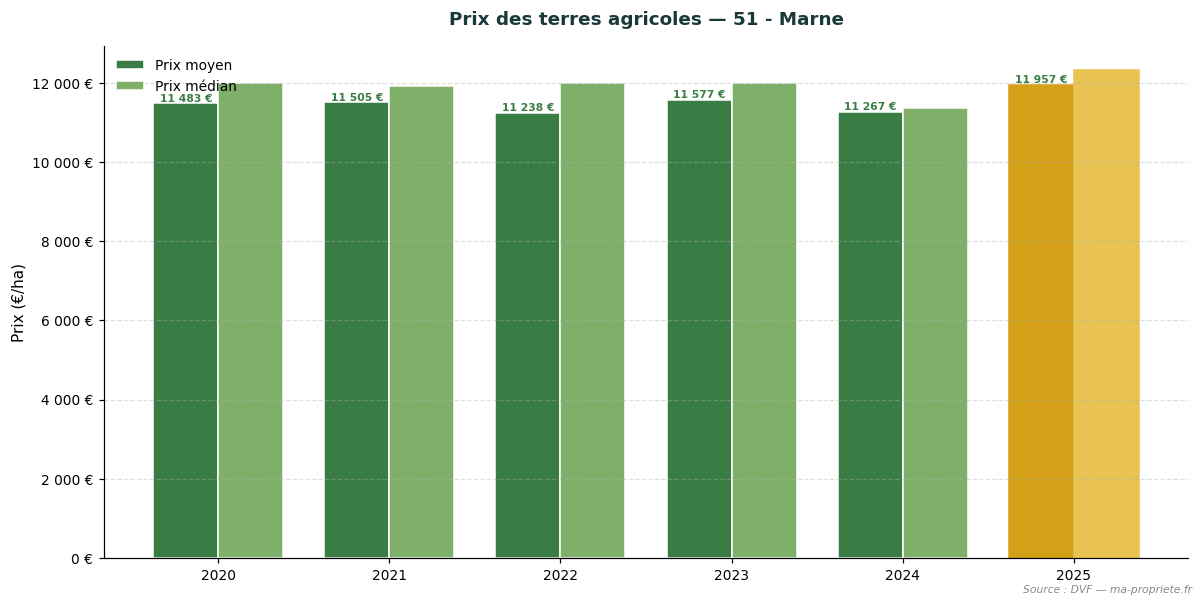
Trend in agricultural land prices — 51 - Marne. Source: DVF, processed by ma-propriete.fr. The year 2025 is highlighted in gold.
Haute-Marne combines arable plateaus with beef cattle farming areas. In 2025, the average price of agricultural land in the department stands at €4,078/ha (+1.0% compared to 2024). The median price reaches €3,500/ha, based on 169 recorded transactions (average area 10.88 ha).
| Year | No. of sales | Average price | Median price | Avg. area |
|---|---|---|---|---|
| 2020 | 82 | €3,369/ha | €3,000/ha | 10.11 ha |
| 2021 | 155 | €3,721/ha | €3,499/ha | 9.32 ha |
| 2022 | 144 | €3,918/ha | €3,575/ha | 10.83 ha |
| 2023 | 144 | €3,831/ha | €3,517/ha | 12.02 ha |
| 2024 | 155 | €4,038/ha | €3,600/ha | 11.83 ha |
| 2025 | 169 | €4,078/ha | €3,500/ha | 10.88 ha |
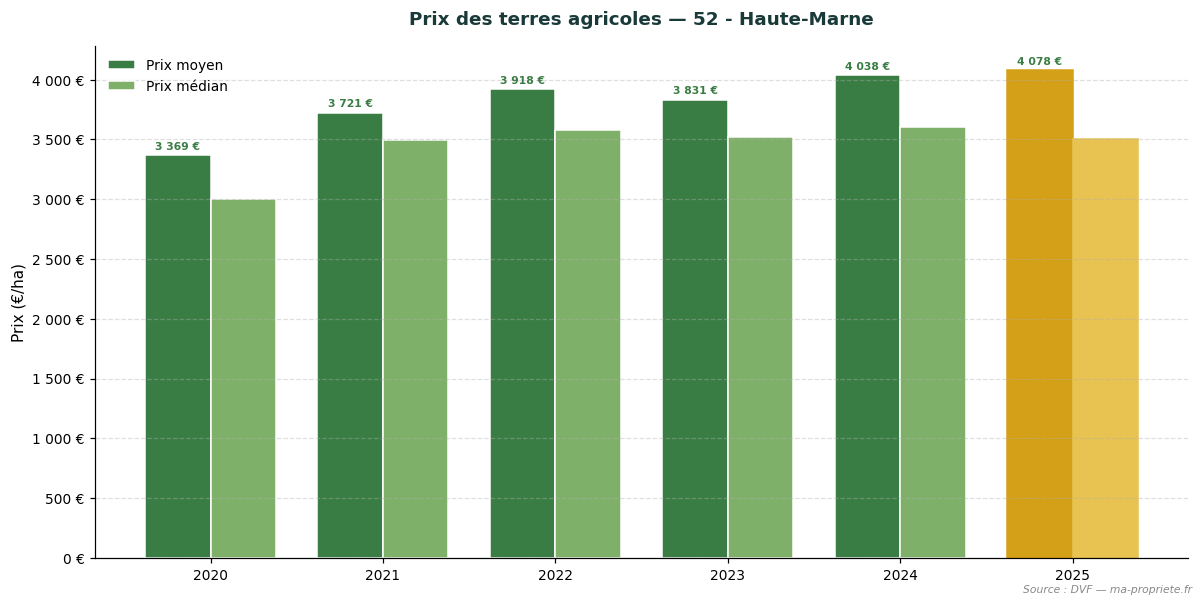
Trend in agricultural land prices — 52 - Haute-Marne. Source: DVF, processed by ma-propriete.fr. The year 2025 is highlighted in gold.
Meurthe-et-Moselle combines arable farming and mixed crop-livestock farming in central Lorraine. In 2025, the average price of agricultural land in the department stands at €5,398/ha (-1.4% compared to 2024). The median price reaches €5,000/ha, based on 143 recorded transactions (average area 13.09 ha).
| Year | No. of sales | Average price | Median price | Avg. area |
|---|---|---|---|---|
| 2020 | 64 | €4,774/ha | €4,400/ha | 10.90 ha |
| 2021 | 145 | €4,810/ha | €4,500/ha | 12.44 ha |
| 2022 | 148 | €4,693/ha | €4,500/ha | 12.81 ha |
| 2023 | 151 | €5,029/ha | €4,727/ha | 9.72 ha |
| 2024 | 142 | €5,476/ha | €5,000/ha | 12.64 ha |
| 2025 | 143 | €5,398/ha | €5,000/ha | 13.09 ha |
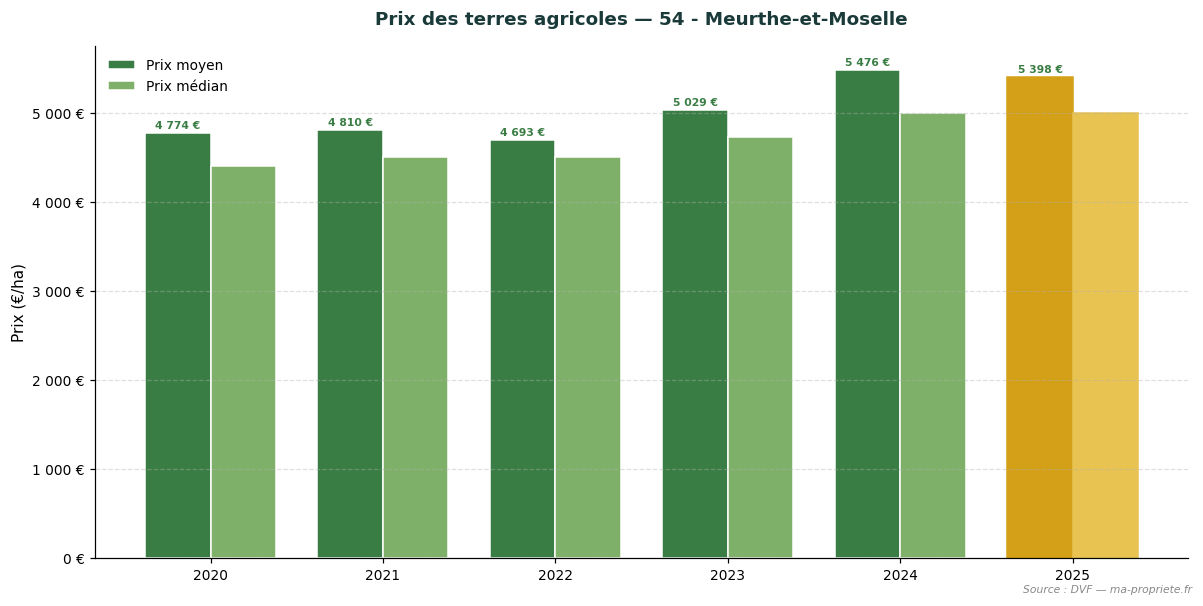
Trend in agricultural land prices — 54 - Meurthe-et-Moselle. Source: DVF, processed by ma-propriete.fr. The year 2025 is highlighted in gold.
Meuse, dominated by mixed crop-livestock farming and arable crops, shows a moderate land market. In 2025, the average price of agricultural land in the department stands at €5,026/ha (-4.0% compared to 2024). The median price reaches €5,000/ha, based on 153 recorded transactions (average area 12.78 ha).
| Year | No. of sales | Average price | Median price | Avg. area |
|---|---|---|---|---|
| 2020 | 87 | €4,897/ha | €4,807/ha | 14.60 ha |
| 2021 | 164 | €5,052/ha | €5,000/ha | 11.62 ha |
| 2022 | 185 | €4,626/ha | €4,500/ha | 11.32 ha |
| 2023 | 187 | €5,100/ha | €4,908/ha | 12.10 ha |
| 2024 | 131 | €5,234/ha | €5,000/ha | 12.42 ha |
| 2025 | 153 | €5,026/ha | €5,000/ha | 12.78 ha |
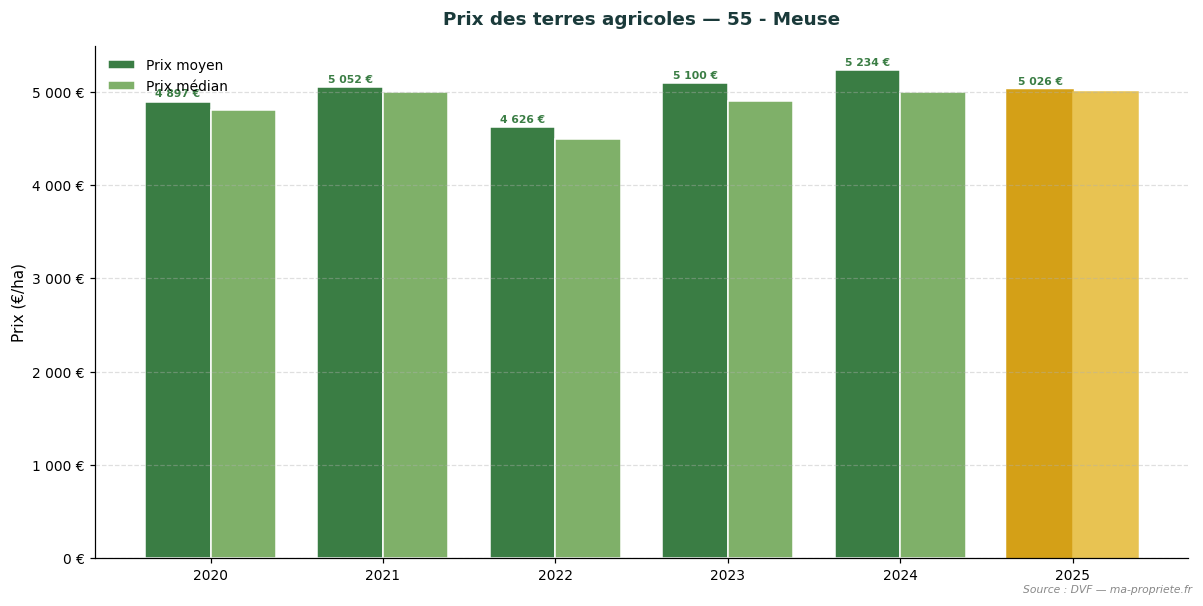
Trend in agricultural land prices — 55 - Meuse. Source: DVF, processed by ma-propriete.fr. The year 2025 is highlighted in gold.
The Vosges, strongly characterised by mountain dairy farming, show the most affordable prices in the region. In 2025, the average price of agricultural land in the department stands at €3,428/ha (+6.3% compared to 2024). The median price reaches €3,200/ha, based on 126 recorded transactions (average area 8.10 ha).
| Year | No. of sales | Average price | Median price | Avg. area |
|---|---|---|---|---|
| 2020 | 69 | €3,503/ha | €3,235/ha | 8.15 ha |
| 2021 | 143 | €3,406/ha | €3,211/ha | 7.69 ha |
| 2022 | 153 | €3,416/ha | €3,277/ha | 8.57 ha |
| 2023 | 117 | €3,436/ha | €3,024/ha | 8.01 ha |
| 2024 | 145 | €3,226/ha | €3,064/ha | 8.39 ha |
| 2025 | 126 | €3,428/ha | €3,200/ha | 8.10 ha |
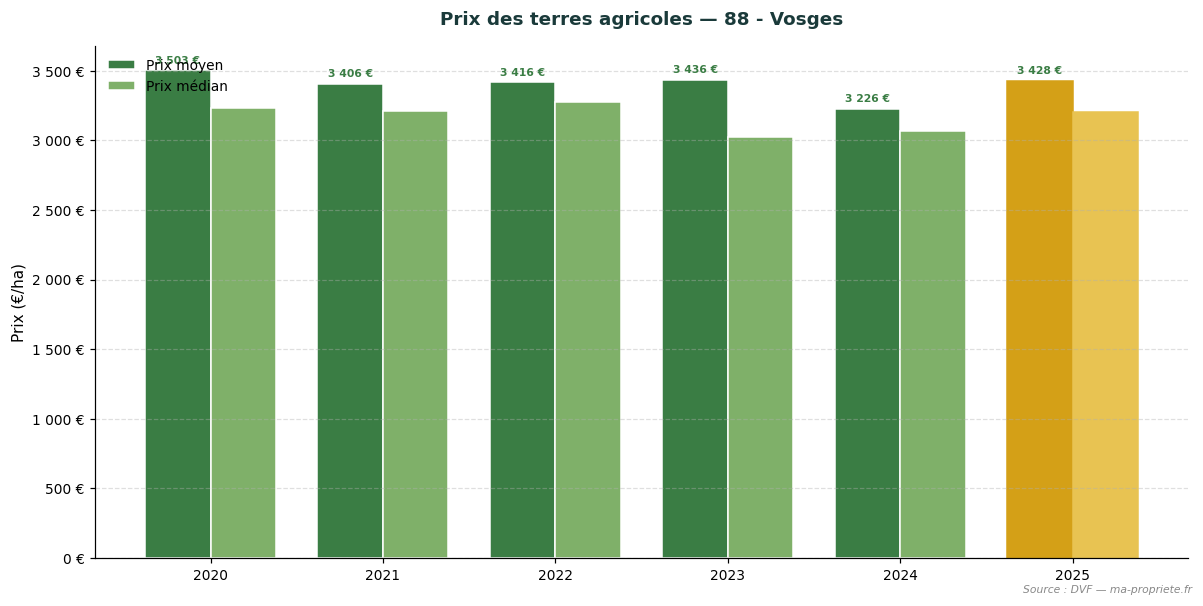
Trend in agricultural land prices — 88 - Vosges. Source: DVF, processed by ma-propriete.fr. The year 2025 is highlighted in gold.
The statistics presented in this article are based on the DVF (Demandes de Valeurs Foncières) database, opened by the Directorate General of Public Finances. This database records all real estate property transfers registered in metropolitan France and in the overseas departments. We applied rigorous filtering to retain only transactions corresponding to strictly agricultural parcels (arable land, grasslands, specialised crops excluding vineyards), systematically excluding built properties, vineyards and AOC wine-growing areas, as well as mixed sales combining parcels and buildings.
For each retained transaction, we calculate the price per hectare by dividing the declared land value by the area of the transferred property. Regional and departmental statistics then aggregate these unit values: average price, median price, first decile (P10) and ninth decile (P90), average area, and total number of annual sales.
The use of DVF data calls for several methodological precautions.
The statistics published annually by the SAFERs (Sociétés d'aménagement foncier et d'établissement rural) and the Ministry of Agriculture differ from our DVF approach in several respects. The SAFERs base their data on transactions subject to their pre-emption rights or their intermediation, which covers only part of the market. They also explicitly distinguish between sales of vacant land (not occupied by a tenant farmer) and sales of tenanted land (already under a rural lease), with a structural discount of approximately 18% for the latter.
The DVF approach, more comprehensive, incorporates all registered transfers without distinction of tenancy status. This explains why average DVF levels may differ from SAFER publications, particularly in regions where the proportion of tenanted sales is significant. We present both series in parallel to offer the most complete picture possible of the agricultural land market.
The year 2025 confirms the stability of the agricultural land market in Grand Est as a whole, with a regional average price of €7,490/ha (+4.7% vs 2024). Behind this average, the region's 7 departments show differentiated dynamics that reflect the diversity of terroirs and production activities. The Alsatian departments (Haut-Rhin 68, Bas-Rhin 67) and Moselle (57) are excluded from DVF data due to the land register system that applies there. Our analysis covers the 7 other departments (Ardennes, Aube, Marne, Haute-Marne, Meurthe-et-Moselle, Meuse, Vosges).
To regularly track developments in the agricultural land market, consult the agricultural land price observatory on ma-propriete.fr, as well as the agricultural section and the agricultural listings published on our portal.
To explore the French agricultural land market in greater depth, find our articles dedicated to each region.