Updated on May 7, 2026: Find the most recent data on our Land Price Observatory (DVF data 2020-2025) which presents average prices, median prices and transaction ranges for your region and each department.
Summary of the main DVF statistics for the year 2025, now available in full. The figures below exclusively cover agricultural land excluding vineyards (arable crops, meadows, plowable land, specialized crops).
| Key figures 2025 — Corsica | |
|---|---|
| Average price | €5,445/ha |
| Median price | €5,012/ha |
| First decile (P10) | €1,980/ha |
| Ninth decile (P90) | €10,317/ha |
| Number of sales | 19 |
| Average area | 11.49 ha |
| Change vs 2024 | -13.0% |
Corsica presents a singular agricultural landscape: extensive sheep and goat farming, fruit growing (clementine, citrus fruits, chestnut), olive growing and beekeeping dominate, on a UAA constrained by the relief. Corsica's UAA represents approximately 170,000 hectares. The main regional agricultural orientations — sheep and goat farming, fruit growing (Corsican clementine PGI, AOC chestnut), olive growing, label productions (honey, brocciu) — structure a land market whose levels and dynamics differ greatly from one department to another.
This article presents the agricultural land prices in Corsica based on DVF data (Property Value Requests) processed by ma-propriete.fr, supplemented by publications from the Ministry of Agriculture derived from SAFER. The year 2025, now available in full, is commented on as a priority; the year 2024 serves as a comparative reference. AOC vineyards (Patrimonio, Ajaccio) are expressly excluded from the scope of this article.
In 2025, the average price of agricultural land in Corsica stands at €5,445/ha, a change of -13.0% compared to 2024. The median price, an indicator less sensitive to extreme transactions, reaches €5,012/ha. Over the entire year, 19 transactions were recorded in the region for an average area per sale of 11.49 ha.
The gap between the first decile (€1,980/ha) and the ninth decile (€10,317/ha) — a P90/P10 ratio of 5.2 — illustrates the price dispersion within the region. This dispersion reflects the heterogeneity of the terroirs, the diversity of productive orientations and the variability of land pressure depending on the zones.
Over the 2021-2025 period (first years fully covered by DVF), the regional average price is declining (-40.2%).
| Year | Number of sales | Average price | Median price | P10 | P90 | Average area |
|---|---|---|---|---|---|---|
| 2020 | 12 | €4,988/ha | €4,223/ha | €1,565/ha | €9,719/ha | 7.43 ha |
| 2021 | 18 | €9,111/ha | €7,649/ha | €2,576/ha | €18,244/ha | 10.90 ha |
| 2022 | 21 | €5,823/ha | €4,493/ha | €1,694/ha | €10,000/ha | 6.13 ha |
| 2023 | 21 | €5,358/ha | €4,957/ha | €2,339/ha | €9,429/ha | 8.18 ha |
| 2024 | 29 | €6,260/ha | €5,366/ha | €1,923/ha | €12,904/ha | 7.21 ha |
| 2025 | 19 | €5,445/ha | €5,012/ha | €1,980/ha | €10,317/ha | 11.49 ha |
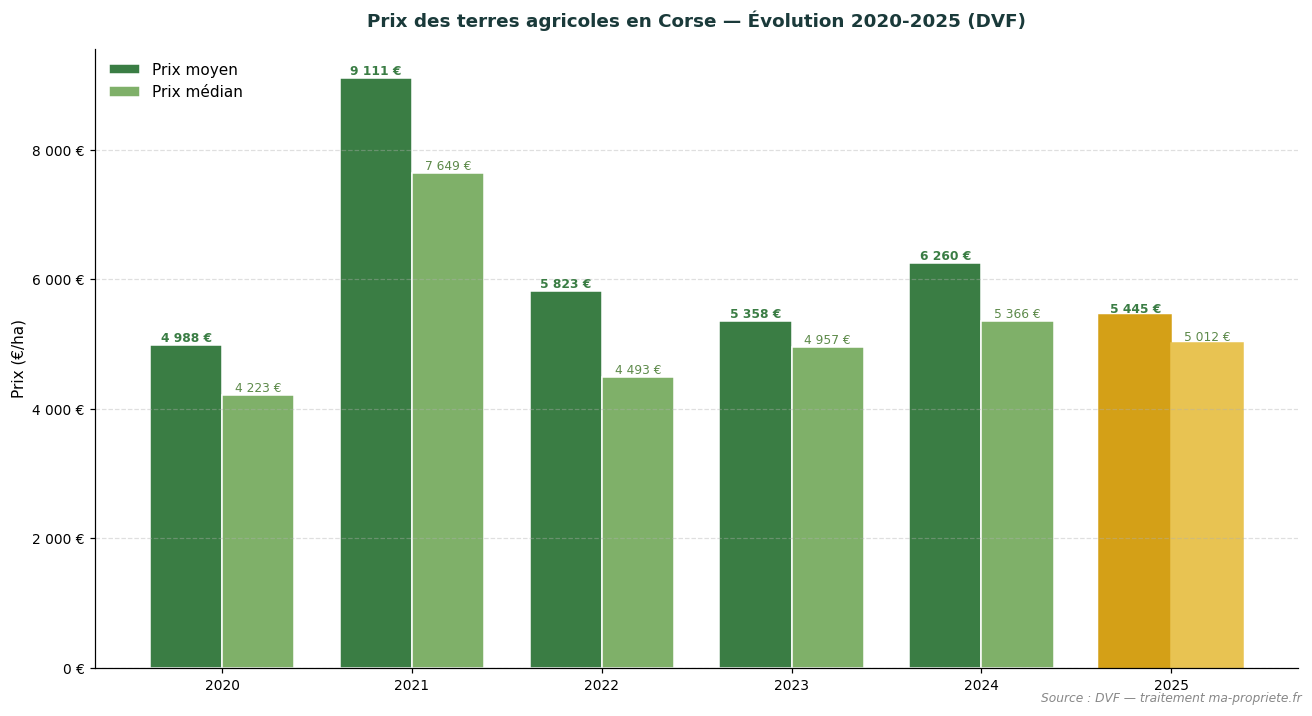
Evolution of the average and median price of agricultural land in Corsica (2020-2025). Source: DVF, processing ma-propriete.fr. The year 2025 is highlighted in gold.
SAFER publishes each year a summary of agricultural land prices, distinguishing sales of free land (plots not occupied by a tenant farmer) and sales of leased land (plots already under rural lease). In Corsica, the most recent year available is 2024: the average price of free land reaches not available (insufficient volume), compared to not available (insufficient volume) for leased land.
| Year | Free land (SAFER) | Leased land (SAFER) |
|---|---|---|
| 2015 | €5,075/ha | — |
| 2018 | €4,980/ha | — |
| 2020 | €5,790/ha | — |
| 2022 | — | — |
| 2023 | — | — |
| 2024 | — | — |
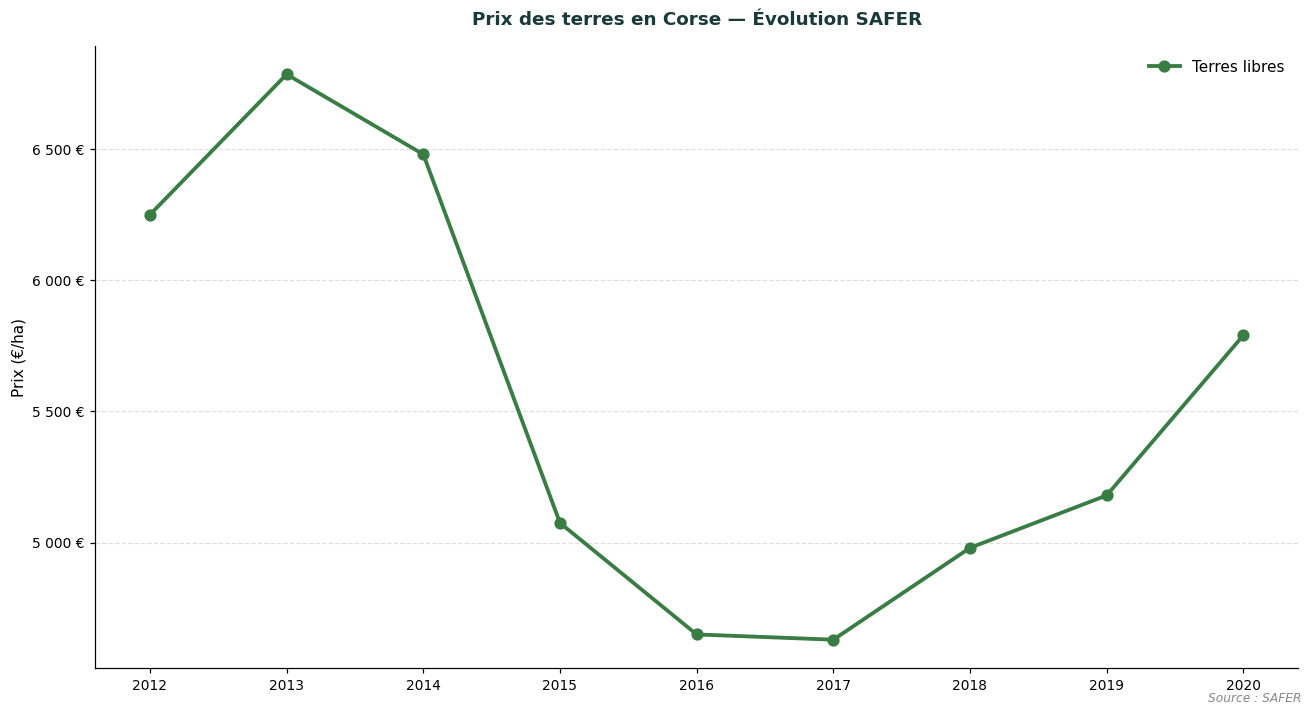
Comparative evolution of free and leased land prices in Corsica. Source: SAFER — Land Prices.
SAFER levels are not directly comparable to the DVF levels presented above: SAFER covers only part of the market (transactions subject to pre-emption rights or intermediation), while DVF reports all registered transfers. The two sources are complementary and allow the land market to be objectified from two distinct angles.
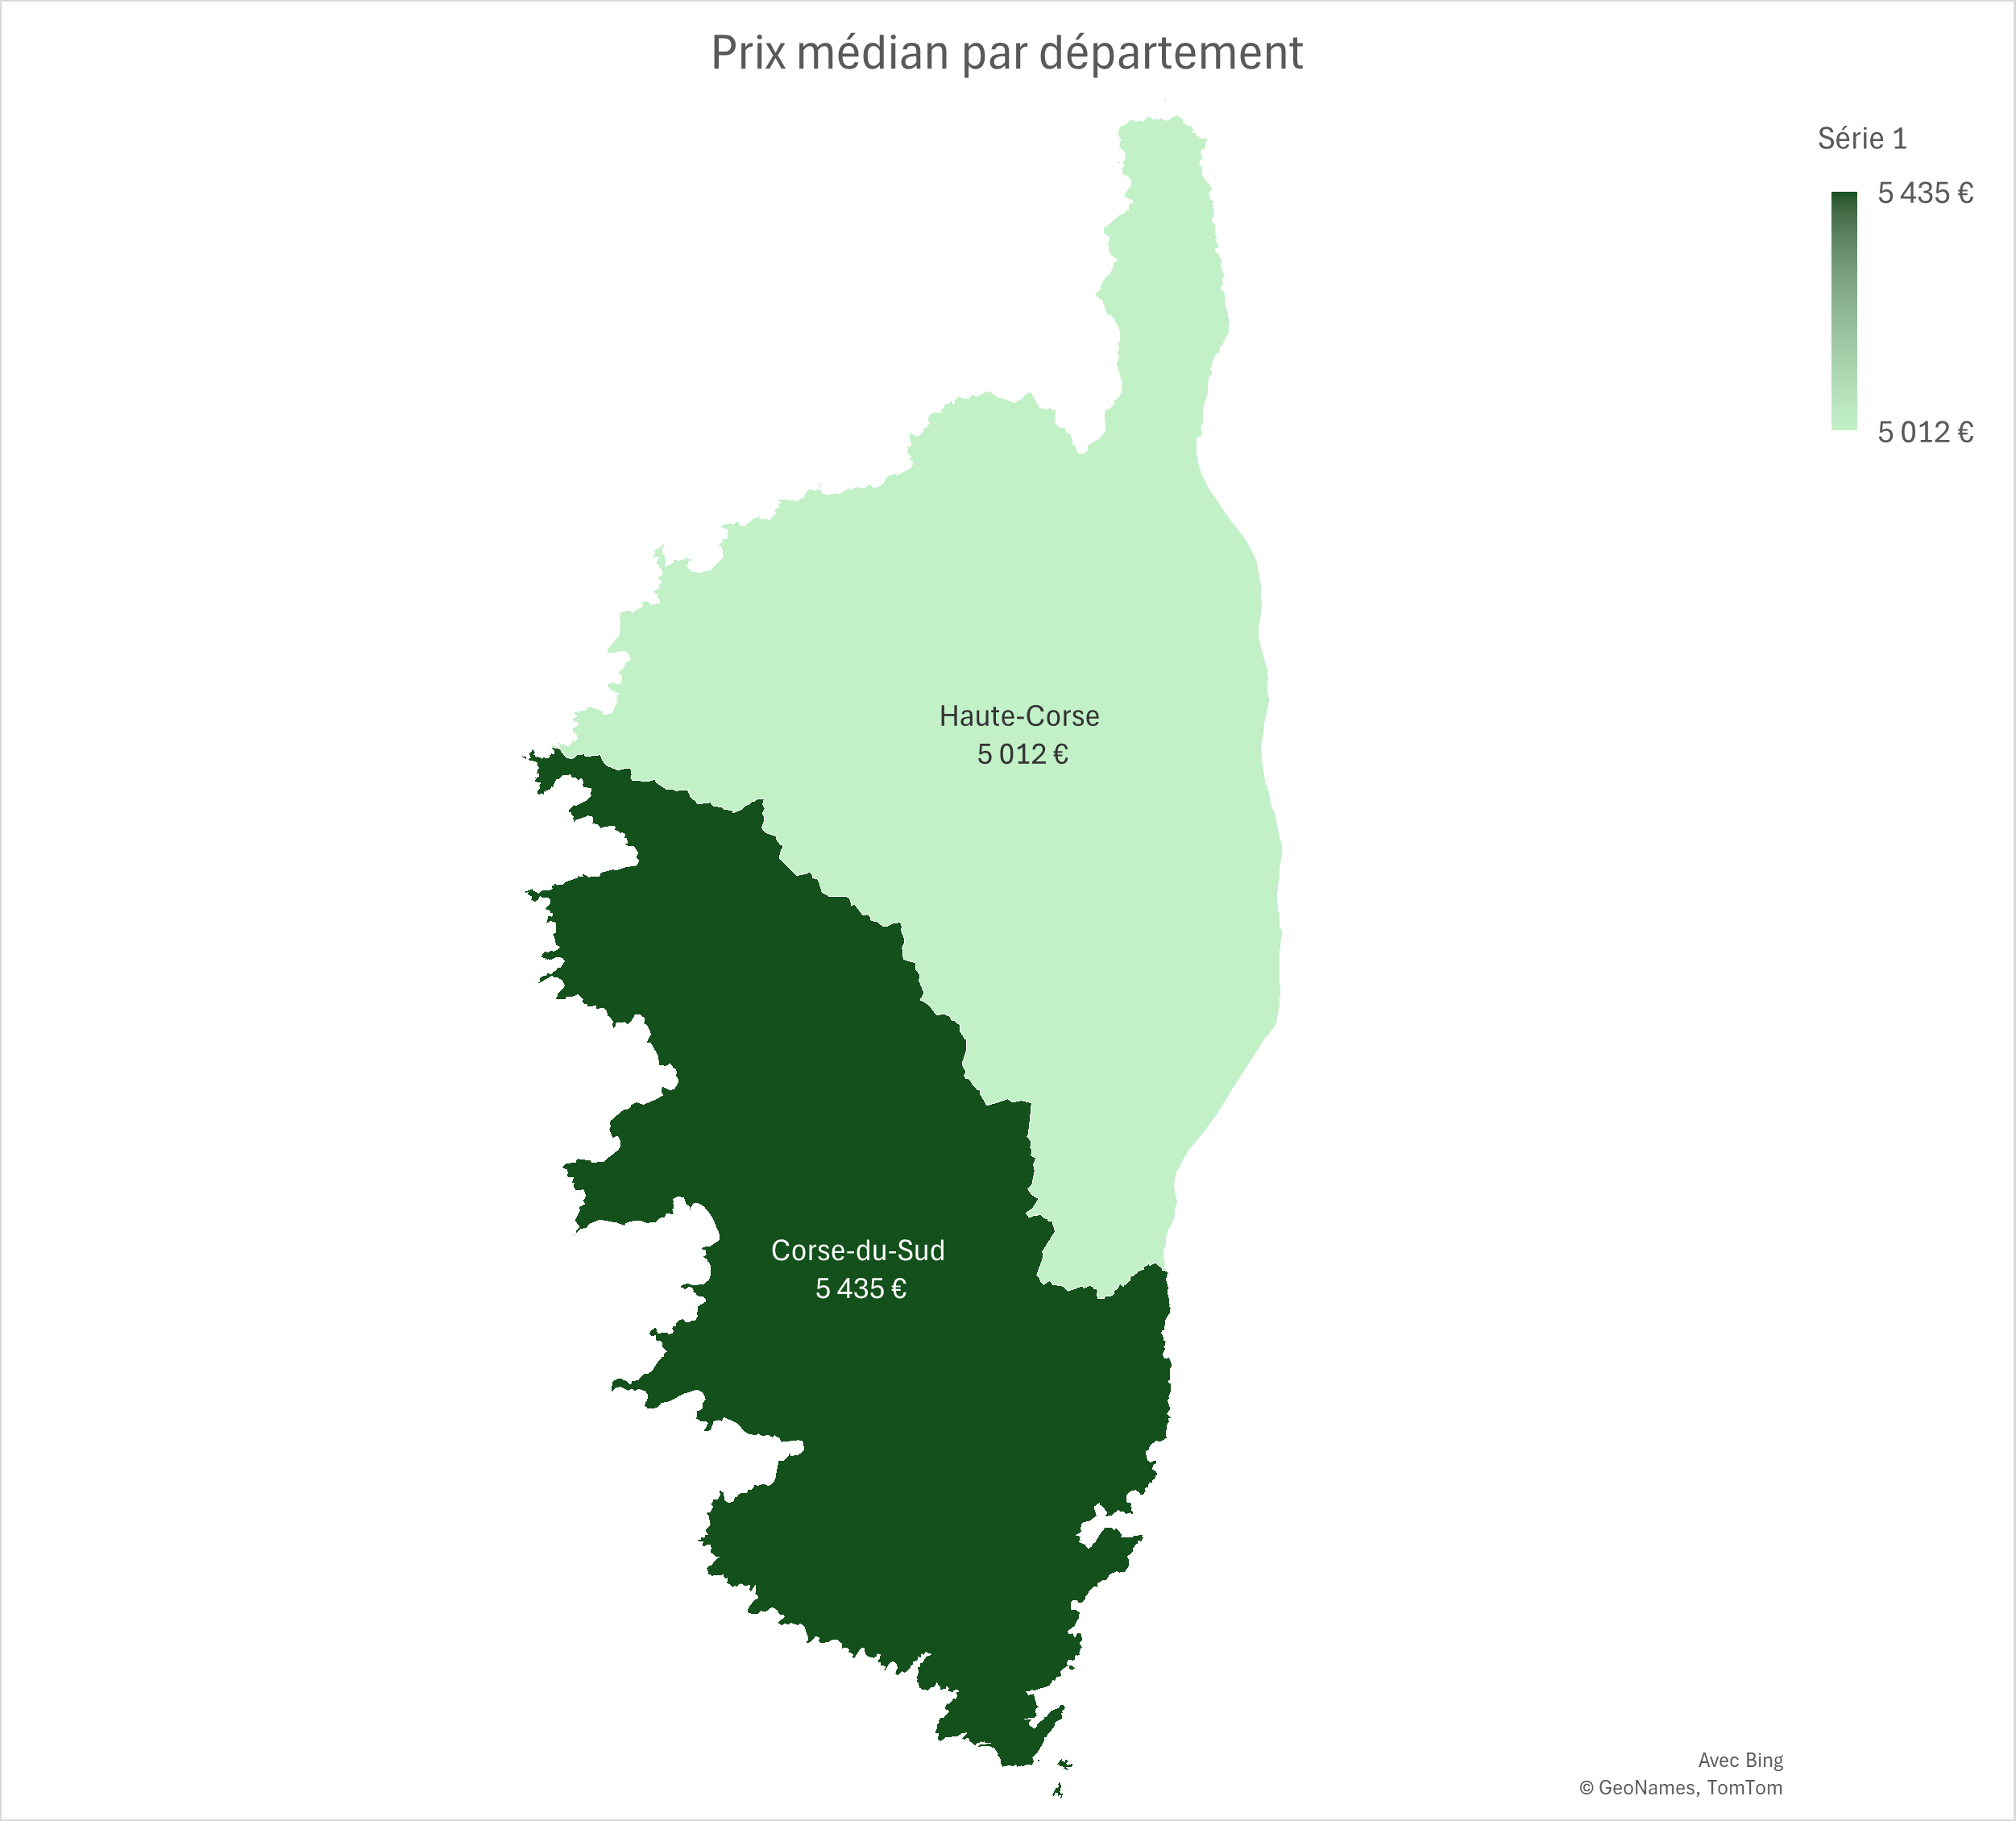
Corse-du-Sud combines extensive livestock farming, olive growing and fruit growing, with a limited transaction volume. In 2025, the average price of agricultural land in the department stands at €7,019/ha (+41.0% compared to 2024). The median price reaches €5,435/ha, based on 6 recorded transactions (average area 7.67 ha). The low number of transactions (less than 30 sales) calls for caution in interpreting annual averages.
| Year | No. sales | Average price | Median price | Avg. area |
|---|---|---|---|---|
| 2020 | — | — | — | — |
| 2021 | 5 | €5,233/ha | €3,933/ha | 8.56 ha |
| 2022 | 11 | €6,020/ha | €4,493/ha | 6.41 ha |
| 2023 | 11 | €4,158/ha | €3,438/ha | 5.31 ha |
| 2024 | 10 | €4,977/ha | €4,563/ha | 7.09 ha |
| 2025 | 6 | €7,019/ha | €5,435/ha | 7.67 ha |
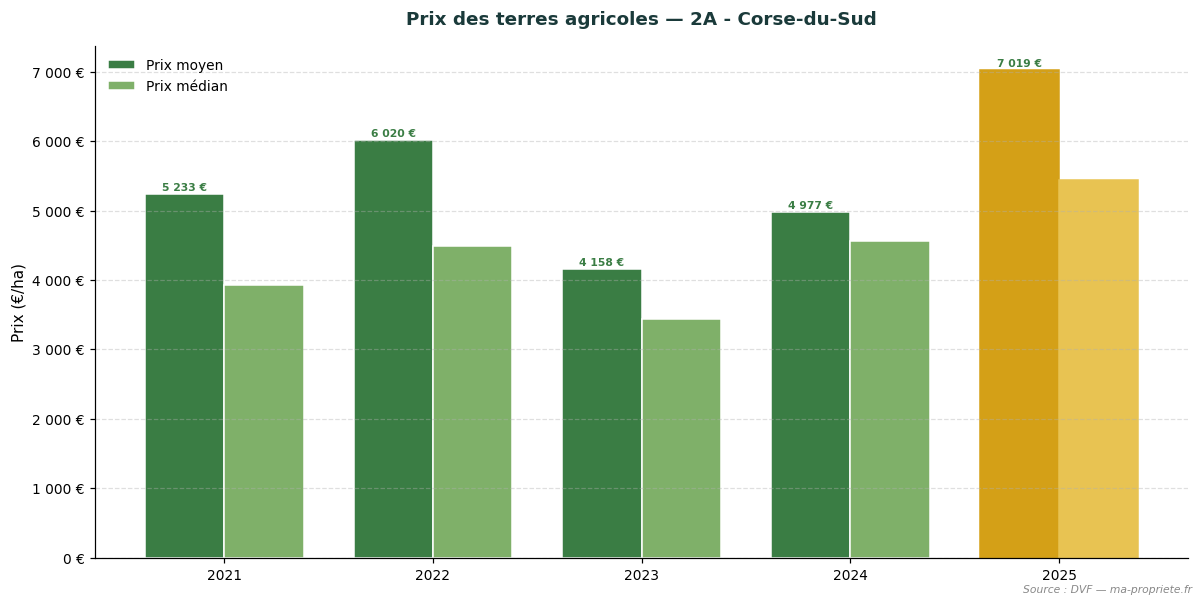
Evolution of agricultural land prices — 2A - Corse-du-Sud. Source: DVF, processing ma-propriete.fr. The year 2025 is highlighted in gold.
Haute-Corse, more focused on livestock farming and fruit growing (clementine), presents a land market constrained by the scarcity of supply. In 2025, the average price of agricultural land in the department stands at €4,719/ha (-32.0% compared to 2024). The median price reaches €5,012/ha, based on 13 recorded transactions (average area 13.25 ha). The low number of transactions (less than 30 sales) calls for caution in interpreting annual averages.
| Year | No. sales | Average price | Median price | Avg. area |
|---|---|---|---|---|
| 2020 | 12 | €4,988/ha | €4,223/ha | 7.43 ha |
| 2021 | 13 | €10,602/ha | €12,176/ha | 11.79 ha |
| 2022 | 10 | €5,605/ha | €4,299/ha | 5.83 ha |
| 2023 | 10 | €6,678/ha | €5,797/ha | 11.34 ha |
| 2024 | 19 | €6,936/ha | €5,366/ha | 7.27 ha |
| 2025 | 13 | €4,719/ha | €5,012/ha | 13.25 ha |
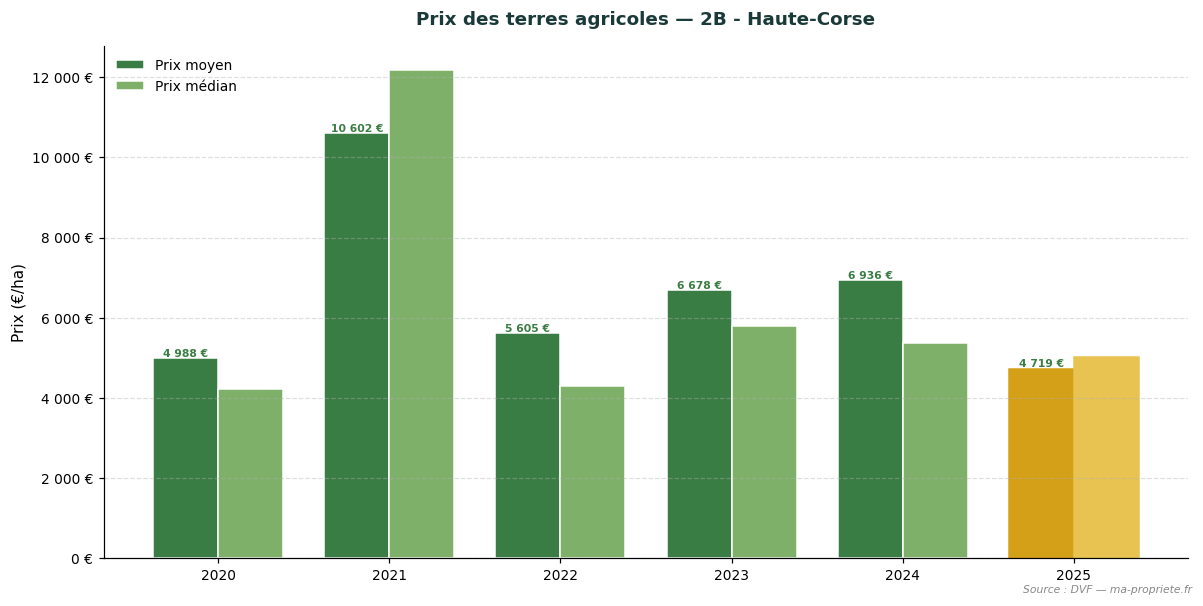
Evolution of agricultural land prices — 2B - Haute-Corse. Source: DVF, processing ma-propriete.fr. The year 2025 is highlighted in gold.
The statistics presented in this article are based on the DVF (Property Value Requests) database, opened by the Directorate General of Public Finance. This database lists all real estate transfers registered in mainland France and in the overseas departments. We applied rigorous filtering to retain only transactions corresponding to strictly agricultural plots (plowable land, meadows, specialized crops excluding vineyards), systematically excluding built properties, vineyards and AOC vineyards, as well as mixed sales combining plots and buildings.
For each transaction retained, we calculate the price per hectare by relating the declared land value to the area of the property transferred. Regional and departmental statistics then aggregate these unit values: average price, median price, first decile (P10) and ninth decile (P90), average area, as well as the total number of annual sales.
The use of DVF data calls for several methodological precautions.
The statistics published each year by SAFER (Land Development and Rural Establishment Companies) and the Ministry of Agriculture differ from our DVF approach on several points. SAFER relies on transactions subject to its pre-emption right or its intermediation, which covers only part of the market. It also explicitly distinguishes sales of free land (not occupied by a tenant farmer) and sales of leased land (already under rural lease), with a structural gap of approximately 18% discount for the latter.
The DVF approach, more exhaustive, includes all registered transfers without distinction of rental status. This explains why DVF average levels may differ from SAFER publications, particularly in regions where the weight of leased sales is significant. We present both series in parallel to offer the most complete view possible of the agricultural land market.
The year 2025 confirms the stability of the agricultural land market in Corsica as a whole, with an average regional price of €5,445/ha (-13.0% vs 2024). Behind this average, the 2 departments of the region present differentiated dynamics that reflect the diversity of terroirs and productive orientations. The Corsican market is characterized by a low volume of transactions, which makes the statistics more volatile from one year to another. Coastal land pressure and tourist appeal weigh heavily on price formation.
To regularly monitor the evolution of the agricultural land market, consult the agricultural land price observatory of ma-propriete.fr, as well as the agricultural section and the agricultural listings published on our portal.
To deepen the analysis of the French agricultural land market, find our articles dedicated to each region.