Updated May 7, 2026: Consult our EXCLUSIVE OBSERVATORY ON FARMLAND PRICES IN FRANCE based on official DVF data.
Summary of the main DVF statistics for the year 2025, now available in full. The figures below relate exclusively to agricultural land excluding vineyards (arable crops, grassland, ploughable land, specialised crops).
| Key figures 2025 — Hauts-de-France | |
|---|---|
| Average price | €8,940/ha |
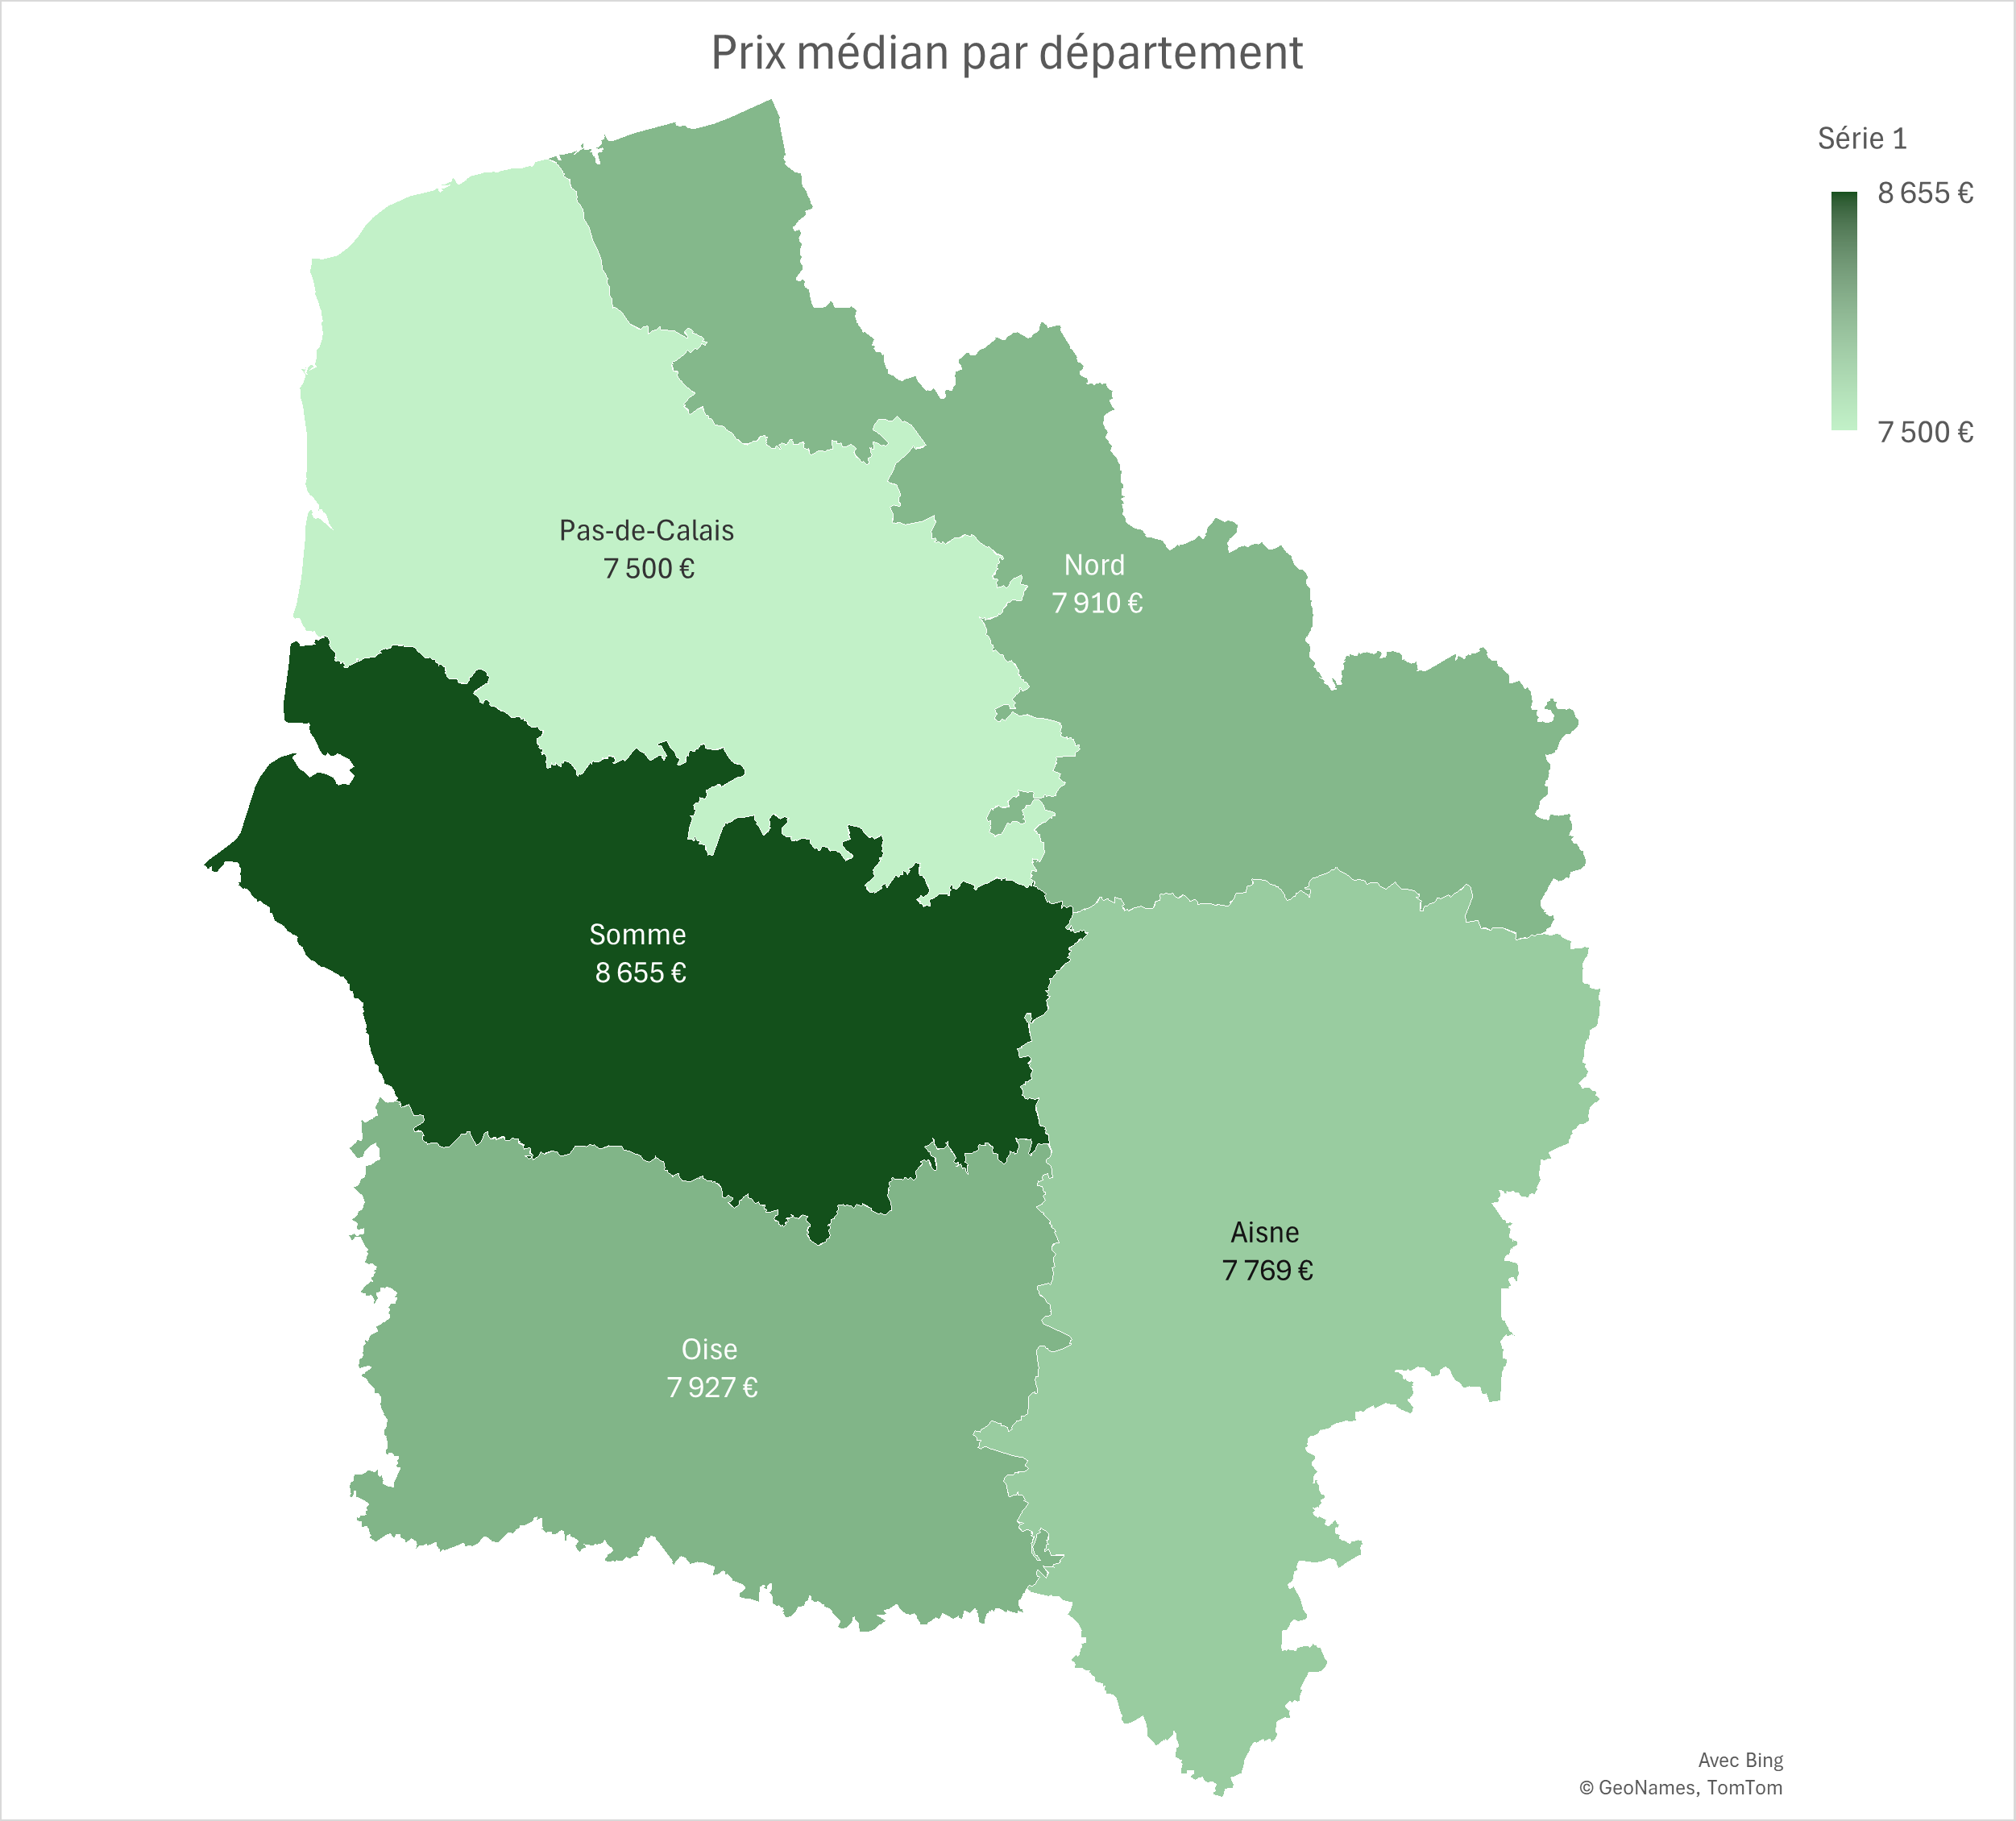
| Median price | €7,976/ha |
| First decile (P10) | €6,000/ha |
| Ninth decile (P90) | €14,000/ha |
| Number of sales | 1,365 |
| Average area | 9.79 ha |
| Change vs 2024 | +2.2% |
Hauts-de-France is one of Europe's most productive cereal and industrial farming regions. The fertility of its loam soils and proximity to processing facilities have persistently driven prices upward. The region encompasses approximately 2.1 million hectares of UAA (Utilisable Agricultural Area). The main regional farming activities — cereal crops (wheat, barley, rapeseed), sugar beet, potato, textile flax, industrial vegetables, and residual mixed crop-livestock farming — shape a land market whose levels and dynamics vary greatly from one department to another.
This article presents agricultural land prices in Hauts-de-France based on DVF (Demandes de Valeurs Foncières) data processed by ma-propriete.fr, supplemented by Ministry of Agriculture publications derived from SAFER data. The year 2025, now available in full, is the primary focus; 2024 serves as a comparative reference.
In 2025, the average price of agricultural land in Hauts-de-France stands at €8,940/ha, representing a change of +2.2% compared to 2024. The median price, a less sensitive indicator to extreme transactions, reaches €7,976/ha. Over the full year, 1,365 transactions were recorded in the region, with an average area per sale of 9.79 ha.
The gap between the first decile (€6,000/ha) and the ninth decile (€14,000/ha) — a P90/P10 ratio of 2.3 — illustrates the dispersion of prices within the region. This dispersion reflects the heterogeneity of terroirs, the diversity of productive orientations, and the variability of land pressure across different zones.
Over the 2021–2025 period (the first years fully covered by DVF), the regional average price has risen (+11.0%).
| Year | Number of sales | Average price | Median price | P10 | P90 | Average area |
|---|---|---|---|---|---|---|
| 2020 | 620 | €8,199/ha | €7,000/ha | €5,352/ha | €13,000/ha | 9.49 ha |
| 2021 | 1,327 | €8,054/ha | €7,000/ha | €5,000/ha | €13,000/ha | 10.09 ha |
| 2022 | 1,302 | €8,318/ha | €7,358/ha | €5,084/ha | €13,441/ha | 10.07 ha |
| 2023 | 1,320 | €8,548/ha | €7,500/ha | €5,500/ha | €14,000/ha | 10.24 ha |
| 2024 | 1,390 | €8,749/ha | €7,689/ha | €5,854/ha | €14,000/ha | 9.46 ha |
| 2025 | 1,365 | €8,940/ha | €7,976/ha | €6,000/ha | €14,000/ha | 9.79 ha |
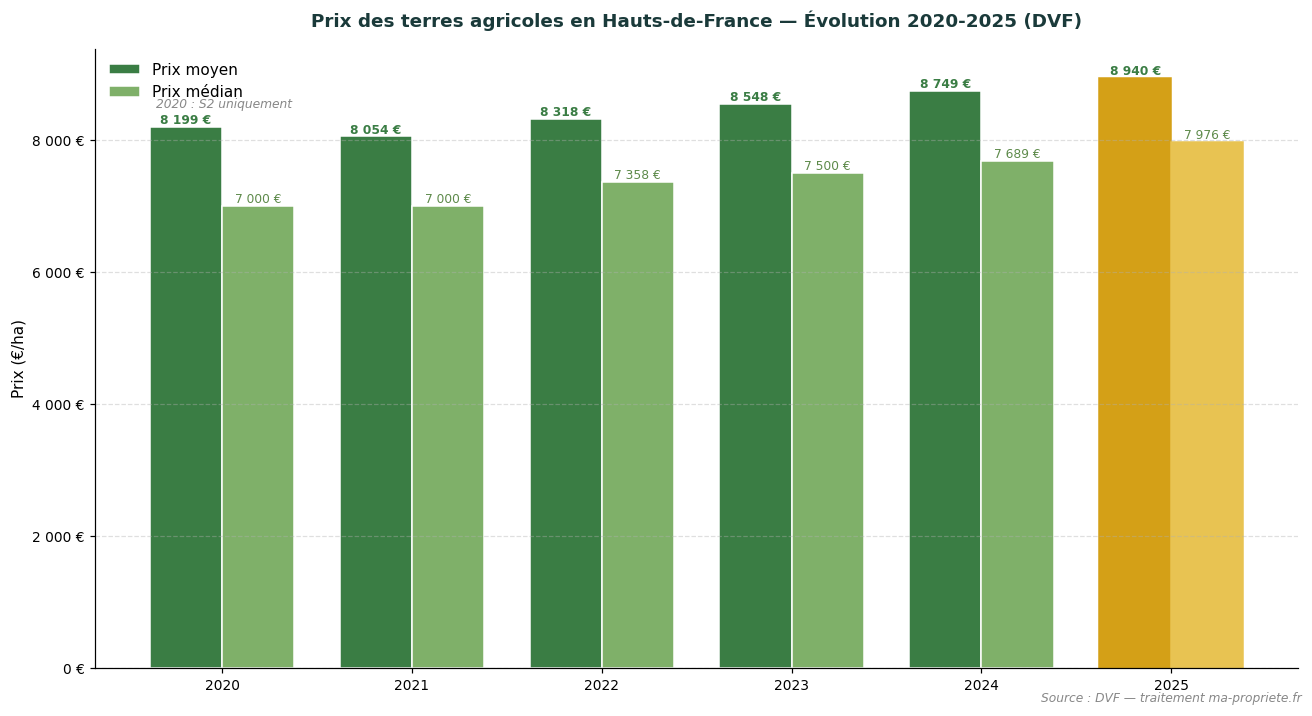
Trend in average and median agricultural land prices in Hauts-de-France (2020–2025). Source: DVF, processed by ma-propriete.fr. The year 2025 is highlighted in gold.
The SAFERs publish an annual summary of agricultural land prices, distinguishing between sales of vacant land (parcels not occupied by a tenant farmer) and sales of tenanted land (parcels already under a rural lease). In Hauts-de-France, the most recent available year is 2024: the average price of vacant land reaches €10,950/ha, compared to €7,230/ha for tenanted land. In 2024, the gap between vacant and tenanted land reaches 34% in Hauts-de-France, broadly in line with the national average (~18%).
| Year | Vacant land (SAFER) | Tenanted land (SAFER) |
|---|---|---|
| 2015 | €9,950/ha | €5,730/ha |
| 2018 | €9,720/ha | €6,310/ha |
| 2020 | €9,670/ha | €6,520/ha |
| 2022 | €9,590/ha | €6,880/ha |
| 2023 | €10,170/ha | €7,050/ha |
| 2024 | €10,950/ha | €7,230/ha |
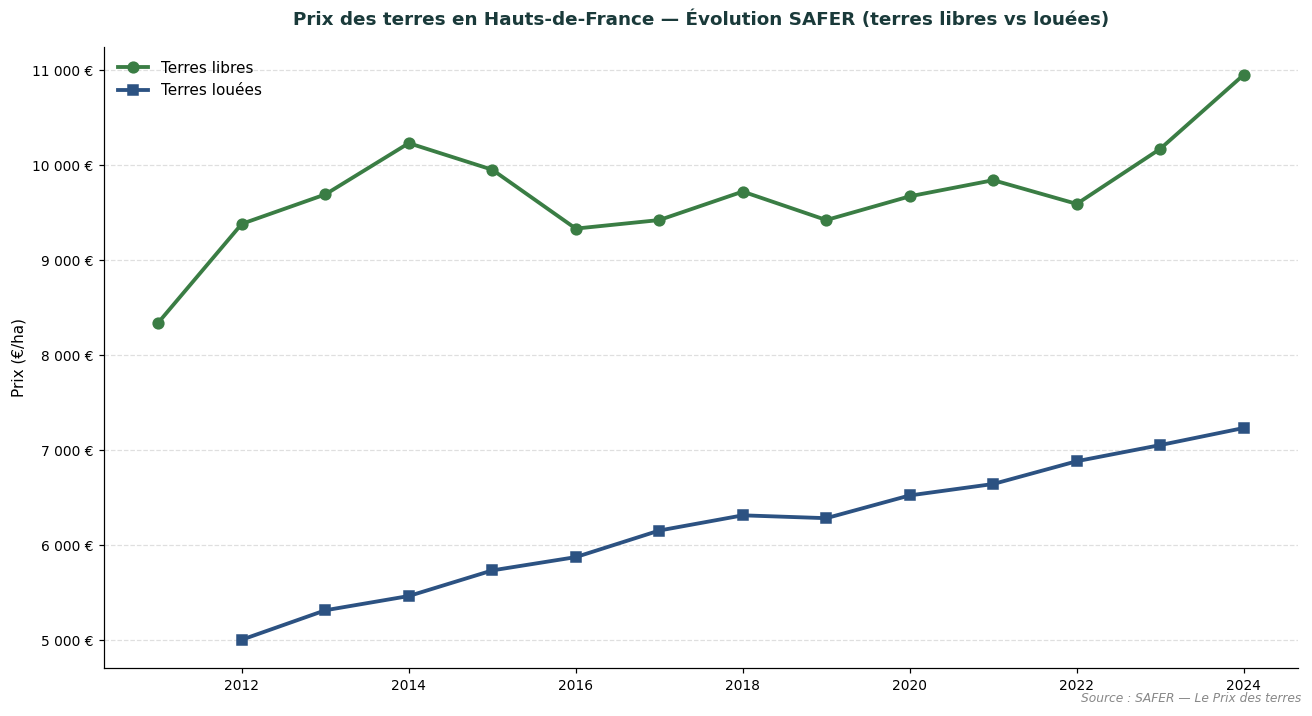
Comparative trend in vacant and tenanted land prices in Hauts-de-France. Source: SAFER — Le Prix des terres.
SAFER figures cannot be directly compared with the DVF figures presented above: SAFER only covers part of the market (transactions subject to pre-emption rights or SAFER intermediation), whereas DVF captures all recorded transfers. The two sources are complementary and provide an objective view of the land market from two distinct angles.
Aisne combines the cereal plateaus of the Soissonnais with livestock farming areas in the Thiérache. In 2025, the average price of agricultural land in the department stands at €8,841/ha (+3.7% compared to 2024). The median price reaches €7,769/ha, based on 251 recorded transactions (average area 12.93 ha).
| Year | No. of sales | Average price | Median price | Avg. area |
|---|---|---|---|---|
| 2020 | 121 | €8,334/ha | €7,198/ha | 12.71 ha |
| 2021 | 259 | €7,980/ha | €7,300/ha | 14.18 ha |
| 2022 | 240 | €8,607/ha | €8,000/ha | 12.19 ha |
| 2023 | 223 | €8,677/ha | €7,515/ha | 18.69 ha |
| 2024 | 267 | €8,522/ha | €7,526/ha | 13.90 ha |
| 2025 | 251 | €8,841/ha | €7,769/ha | 12.93 ha |
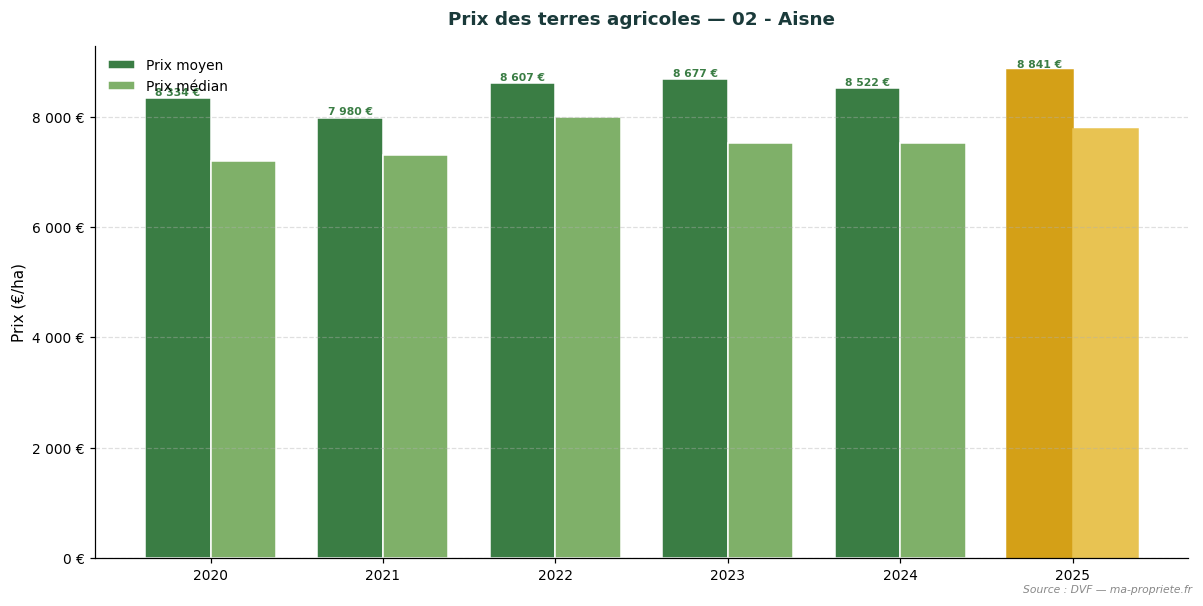
Trend in agricultural land prices — 02 - Aisne. Source: DVF, processed by ma-propriete.fr. The year 2025 is highlighted in gold.
Nord combines arable farming (sugar beet, potato) with dairy livestock in the Avesnois. In 2025, the average price of agricultural land in the department stands at €9,021/ha (-1.0% compared to 2024). The median price reaches €7,910/ha, based on 347 recorded transactions (average area 8.78 ha).
| Year | No. of sales | Average price | Median price | Avg. area |
|---|---|---|---|---|
| 2020 | 151 | €7,804/ha | €6,840/ha | 7.20 ha |
| 2021 | 326 | €8,176/ha | €7,000/ha | 7.66 ha |
| 2022 | 308 | €7,833/ha | €6,912/ha | 7.80 ha |
| 2023 | 321 | €8,749/ha | €7,427/ha | 7.39 ha |
| 2024 | 313 | €9,116/ha | €7,650/ha | 7.87 ha |
| 2025 | 347 | €9,021/ha | €7,910/ha | 8.78 ha |
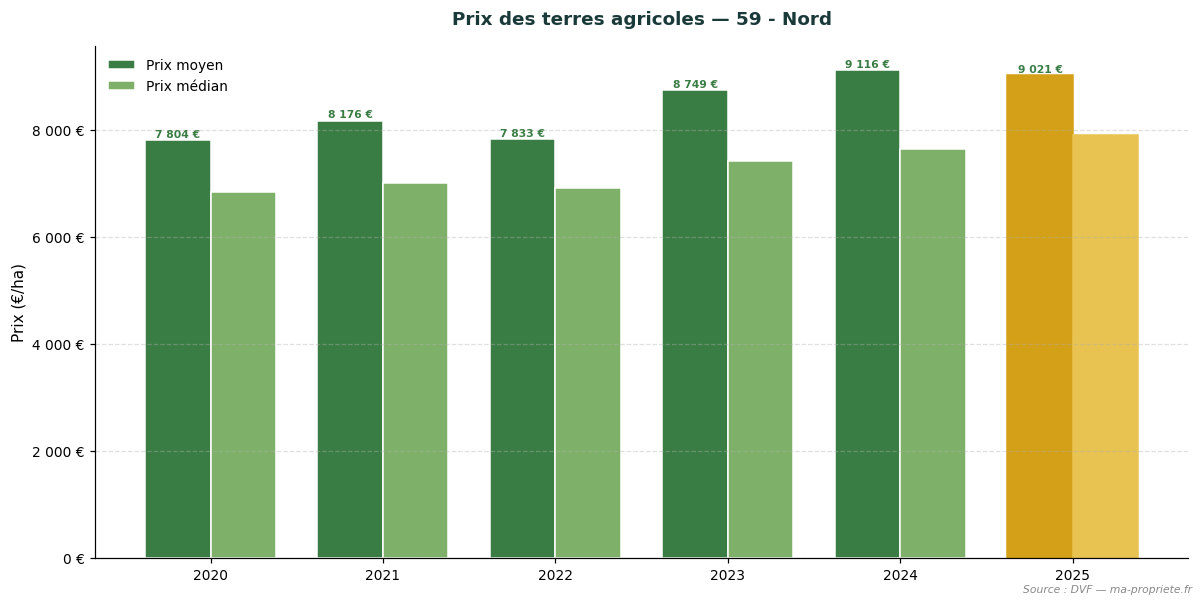
Trend in agricultural land prices — 59 - Nord. Source: DVF, processed by ma-propriete.fr. The year 2025 is highlighted in gold.
Oise, set on the loam plains of the Valois and Beauvaisis, is one of the departments with the highest agricultural potential. In 2025, the average price of agricultural land in the department stands at €8,723/ha (+1.5% compared to 2024). The median price reaches €7,927/ha, based on 174 recorded transactions (average area 13.26 ha).
| Year | No. of sales | Average price | Median price | Avg. area |
|---|---|---|---|---|
| 2020 | 82 | €7,049/ha | €6,798/ha | 12.98 ha |
| 2021 | 168 | €8,092/ha | €7,112/ha | 15.51 ha |
| 2022 | 171 | €7,912/ha | €7,200/ha | 15.57 ha |
| 2023 | 190 | €8,087/ha | €7,500/ha | 12.88 ha |
| 2024 | 180 | €8,594/ha | €7,868/ha | 12.46 ha |
| 2025 | 174 | €8,723/ha | €7,927/ha | 13.26 ha |
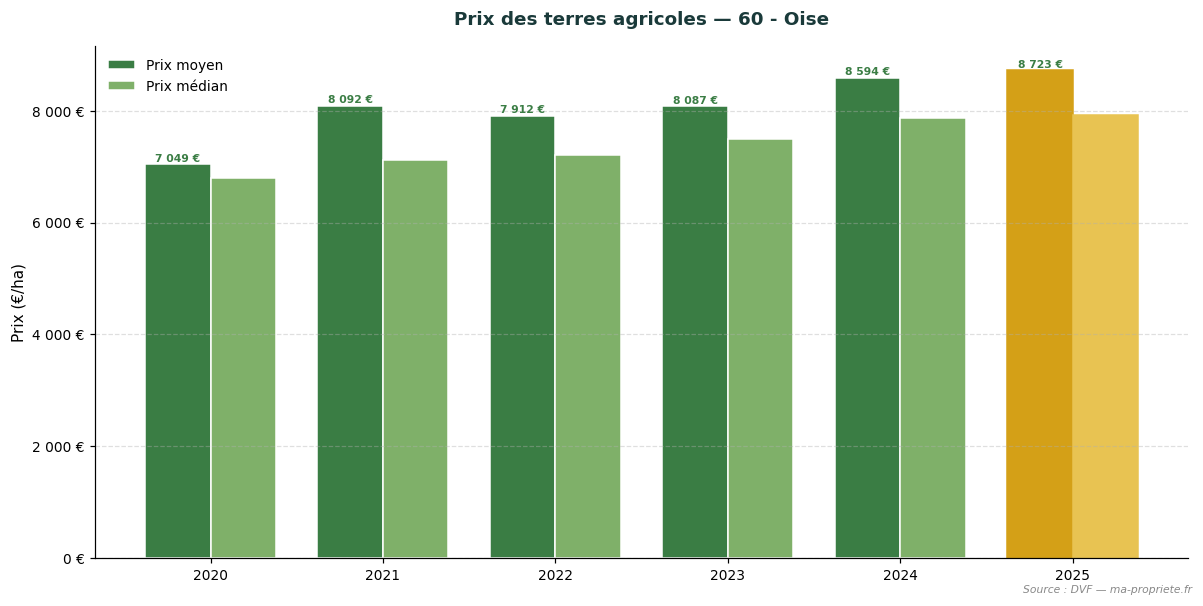
Trend in agricultural land prices — 60 - Oise. Source: DVF, processed by ma-propriete.fr. The year 2025 is highlighted in gold.
Pas-de-Calais combines arable farming in the Artois with dairy livestock in the Boulonnais. In 2025, the average price of agricultural land in the department stands at €8,667/ha (-0.9% compared to 2024). The median price reaches €7,500/ha, based on 326 recorded transactions (average area 7.77 ha).
| Year | No. of sales | Average price | Median price | Avg. area |
|---|---|---|---|---|
| 2020 | 149 | €8,168/ha | €6,903/ha | 7.57 ha |
| 2021 | 301 | €8,068/ha | €6,761/ha | 7.83 ha |
| 2022 | 302 | €8,512/ha | €7,310/ha | 8.09 ha |
| 2023 | 329 | €8,627/ha | €7,042/ha | 7.47 ha |
| 2024 | 347 | €8,747/ha | €7,366/ha | 6.75 ha |
| 2025 | 326 | €8,667/ha | €7,500/ha | 7.77 ha |
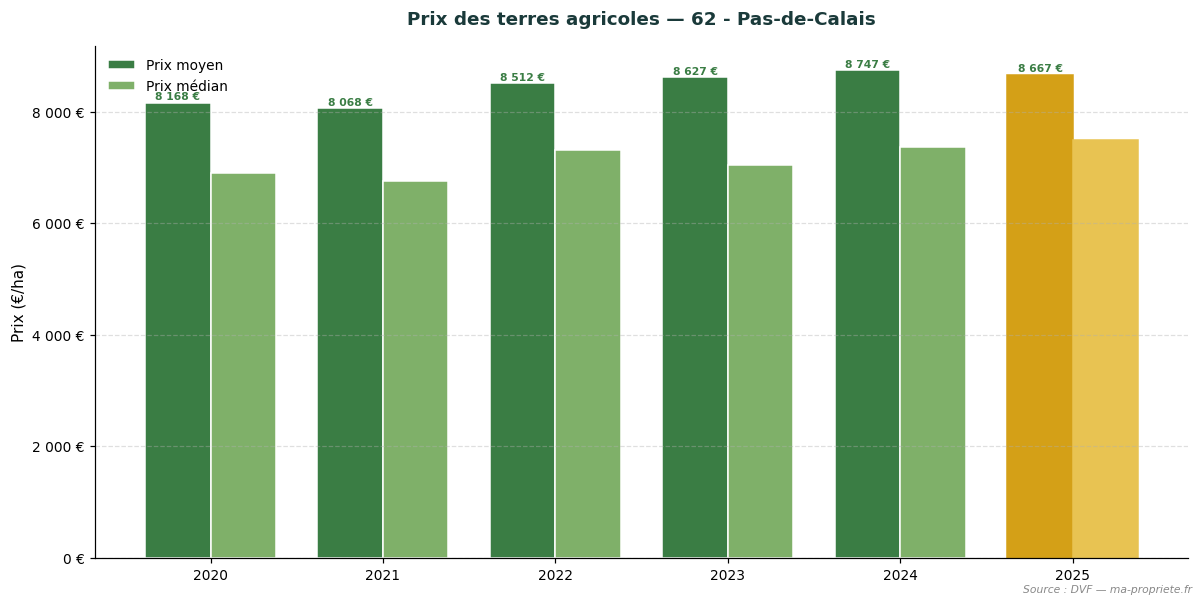
Trend in agricultural land prices — 62 - Pas-de-Calais. Source: DVF, processed by ma-propriete.fr. The year 2025 is highlighted in gold.
Somme, predominantly cereal and sugar beet farming, has one of the most active land markets in Hauts-de-France. In 2025, the average price of agricultural land in the department stands at €9,402/ha (+8.6% compared to 2024). The median price reaches €8,655/ha, based on 267 recorded transactions (average area 8.37 ha).
| Year | No. of sales | Average price | Median price | Avg. area |
|---|---|---|---|---|
| 2020 | 117 | €9,416/ha | €7,300/ha | 9.12 ha |
| 2021 | 273 | €7,943/ha | €7,250/ha | 8.24 ha |
| 2022 | 281 | €8,641/ha | €7,603/ha | 9.52 ha |
| 2023 | 257 | €8,425/ha | €8,000/ha | 8.09 ha |
| 2024 | 283 | €8,661/ha | €8,000/ha | 8.42 ha |
| 2025 | 267 | €9,402/ha | €8,655/ha | 8.37 ha |
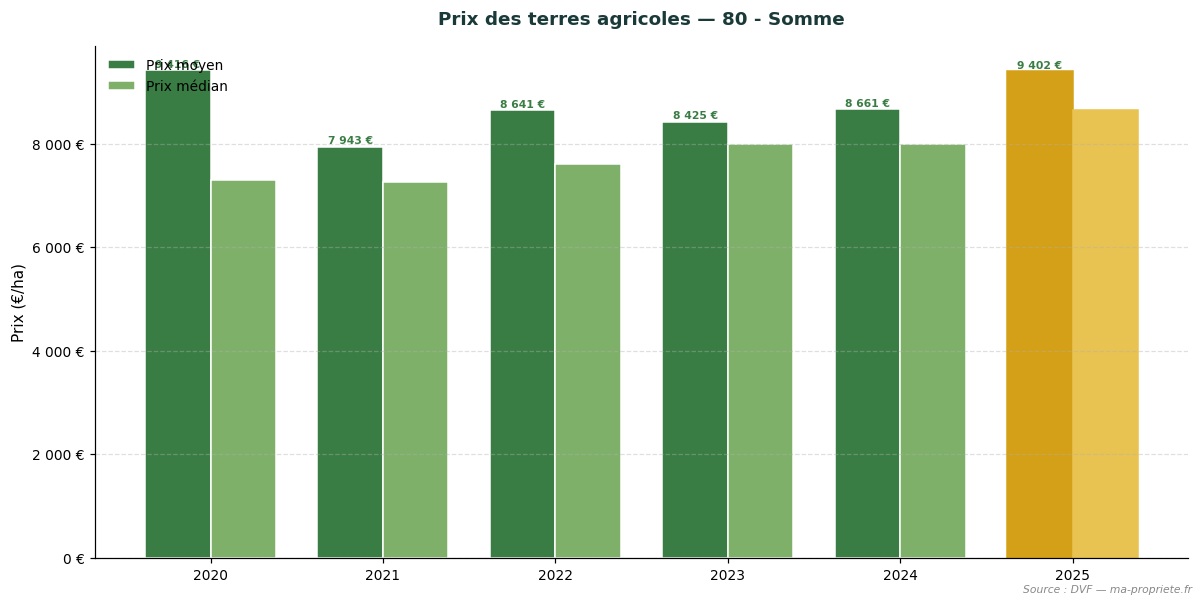
Trend in agricultural land prices — 80 - Somme. Source: DVF, processed by ma-propriete.fr. The year 2025 is highlighted in gold.
The statistics presented in this article are based on the DVF (Demandes de Valeurs Foncières) database, published by the Directorate General of Public Finances. This database records all real estate land transfers registered in mainland France and the overseas departments. We applied rigorous filtering to retain only transactions corresponding to strictly agricultural parcels (arable land, grassland, specialised crops excluding vineyards), systematically excluding built properties, vineyards and AOC wine estates, as well as mixed sales combining parcels and buildings.
For each retained transaction, we calculate the price per hectare by dividing the declared land value by the area of the transferred property. Regional and departmental statistics then aggregate these unit values: average price, median price, first decile (P10) and ninth decile (P90), average area, and total number of annual sales.
The use of DVF data requires several methodological precautions.
The statistics published annually by the SAFERs (Sociétés d'aménagement foncier et d'établissement rural) and the Ministry of Agriculture differ from our DVF approach on several points. The SAFERs draw on transactions subject to their pre-emption rights or intermediation, which covers only part of the market. They also explicitly distinguish between sales of vacant land (not occupied by a tenant farmer) and sales of tenanted land (already under a rural lease), with a structural discount of approximately 18% for the latter.
The DVF approach, being more comprehensive, incorporates all recorded transfers regardless of tenancy status. This explains why average DVF levels may differ from SAFER publications, particularly in regions where tenanted sales account for a significant share. We present both series in parallel to provide the most complete possible picture of the agricultural land market.
The year 2025 confirms the stability of the agricultural land market in Hauts-de-France as a whole, with a regional average price of €8,940/ha (+2.2% vs 2024). Behind this average, the region's 5 departments display differentiated dynamics that reflect the diversity of terroirs and productive orientations. This is one of the regions where DVF transactions are the most numerous and most consistent. Pas-de-Calais, Oise and Somme form the heart of the market, with average prices above €8,000/ha.
To regularly monitor developments in the agricultural land market, consult the agricultural land price observatory on ma-propriete.fr, as well as the agricultural section and the agricultural listings published on our portal.
To explore the French agricultural land market in greater depth, find our articles dedicated to each region.