Updated on 7 May 2026: Find the most recent data on our Agricultural Land Price Observatory (DVF data 2020-2025), which presents average and median prices and transaction ranges for your region and each département.
Summary of the main DVF statistics for the year 2025, now available in full. The figures below relate exclusively to agricultural land excluding vineyards (arable crops, grassland, ploughland, specialised crops).
| Key figures 2025 — Nouvelle-Aquitaine | |
|---|---|
| Average price | €5,135/ha |
| Median price | €4,538/ha |
| First decile (P10) | €2,500/ha |
| Ninth decile (P90) | €8,190/ha |
| Number of sales | 2,103 |
| Average area | 11.21 ha |
| Change vs 2024 | -2.7% |
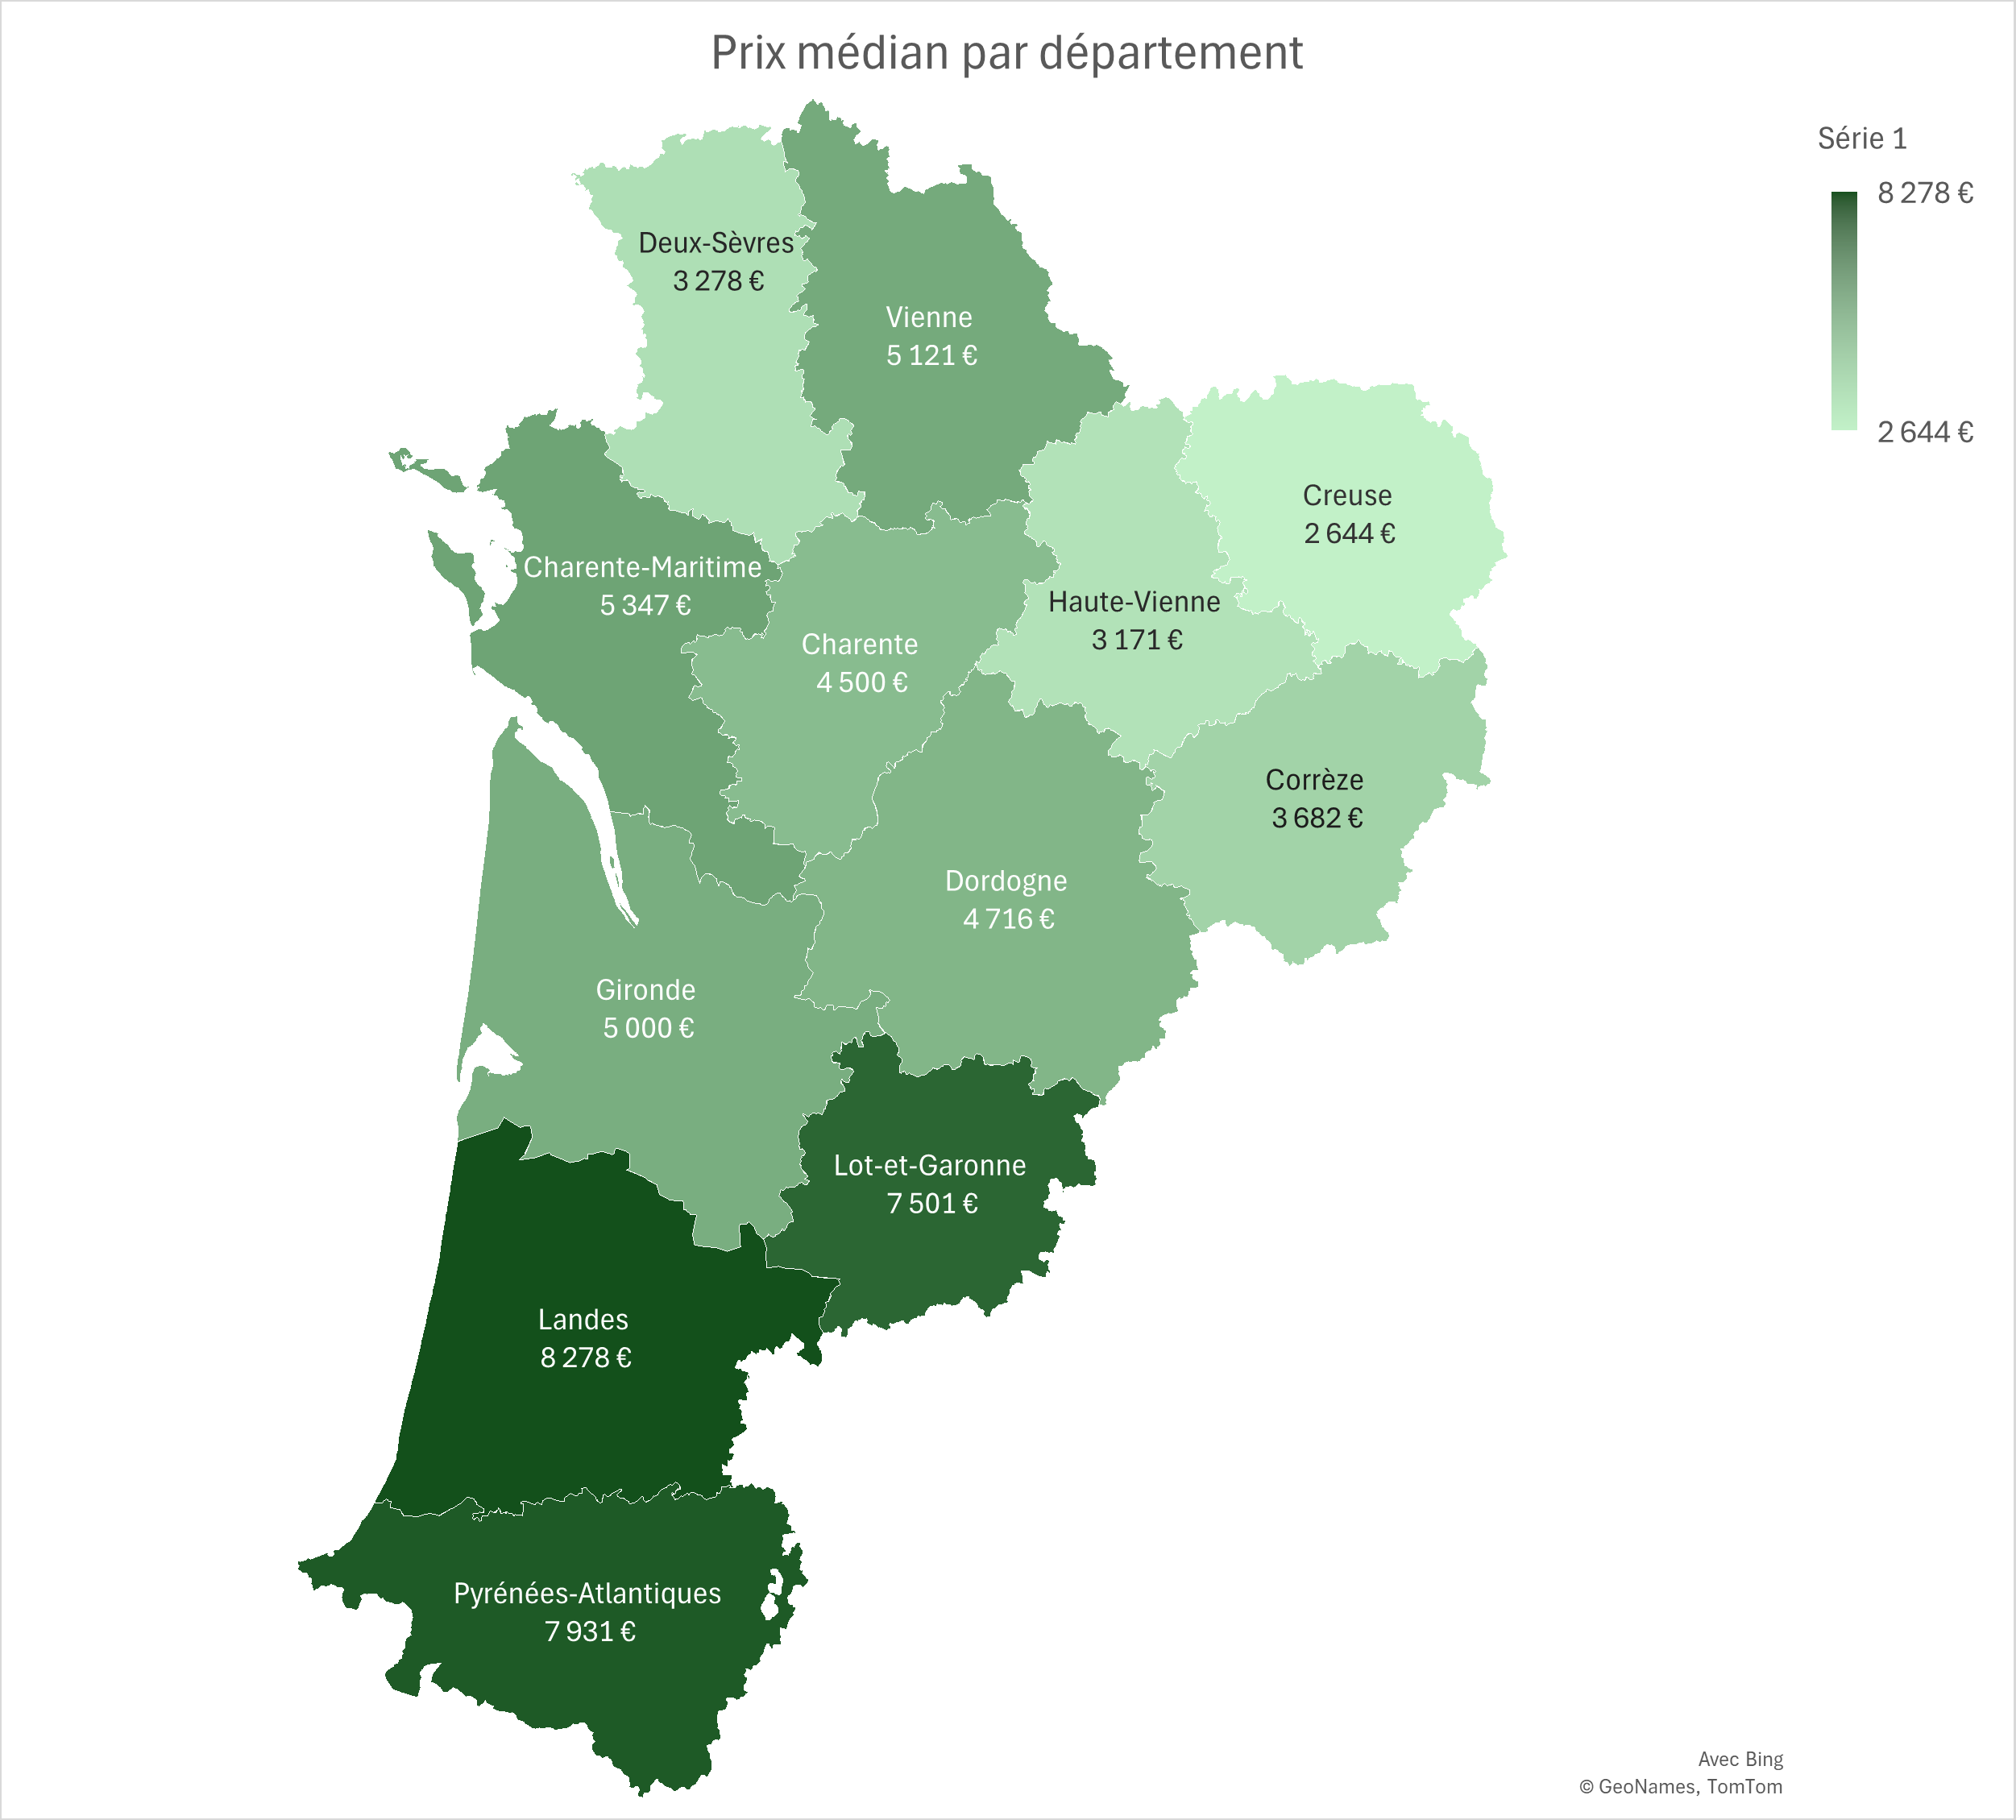
Nouvelle-Aquitaine is France's largest agricultural region by area, spanning 12 départements with very diverse farming systems: arable crops from the southern Paris Basin, livestock farming in Limousin, and market gardening in the South-West. The region's utilised agricultural area (UAA) exceeds 3.8 million hectares. The main regional farming systems — Limousin and Charolais suckler cattle, arable crops in Vienne and Charente, irrigated maize in Landes and Gironde, mixed farming in Dordogne, PGI-labelled productions — structure a land market whose price levels and dynamics differ considerably from one département to another.
This article presents agricultural land prices in Nouvelle-Aquitaine based on DVF (Demandes de Valeurs Foncières) data processed by ma-propriete.fr, supplemented by Ministry of Agriculture publications from the SAFER networks. The year 2025, now available in full, is the primary focus; 2024 serves as the comparative benchmark. The Bordeaux, Cognac and Lot Valley wine regions form a distinct market and are expressly excluded from the scope of this article.
In 2025, the average price of agricultural land in Nouvelle-Aquitaine stands at €5,135/ha, representing a change of -2.7% compared with 2024. The median price, a measure less sensitive to extreme transactions, reaches €4,538/ha. Over the full year, 2,103 transactions were recorded in the region, with an average area per sale of 11.21 ha.
The gap between the first decile (€2,500/ha) and the ninth decile (€8,190/ha) — a P90/P10 ratio of 3.3 — illustrates the dispersion of prices within the region. This dispersion reflects the heterogeneity of soils, the diversity of farming systems and the variability of land market pressure across different areas.
Over the 2021–2025 period (the first years fully covered by DVF), the regional average price is virtually stable (-0.5%).
| Year | Number of sales | Average price | Median price | P10 | P90 | Average area |
|---|---|---|---|---|---|---|
| 2020 | 1,077 | €5,254/ha | €4,500/ha | €2,479/ha | €9,108/ha | 10.56 ha |
| 2021 | 2,192 | €5,160/ha | €4,498/ha | €2,426/ha | €8,804/ha | 10.38 ha |
| 2022 | 2,278 | €5,074/ha | €4,321/ha | €2,411/ha | €8,880/ha | 10.76 ha |
| 2023 | 2,275 | €5,167/ha | €4,500/ha | €2,495/ha | €8,735/ha | 11.00 ha |
| 2024 | 2,131 | €5,276/ha | €4,551/ha | €2,500/ha | €8,712/ha | 10.85 ha |
| 2025 | 2,103 | €5,135/ha | €4,538/ha | €2,500/ha | €8,190/ha | 11.21 ha |
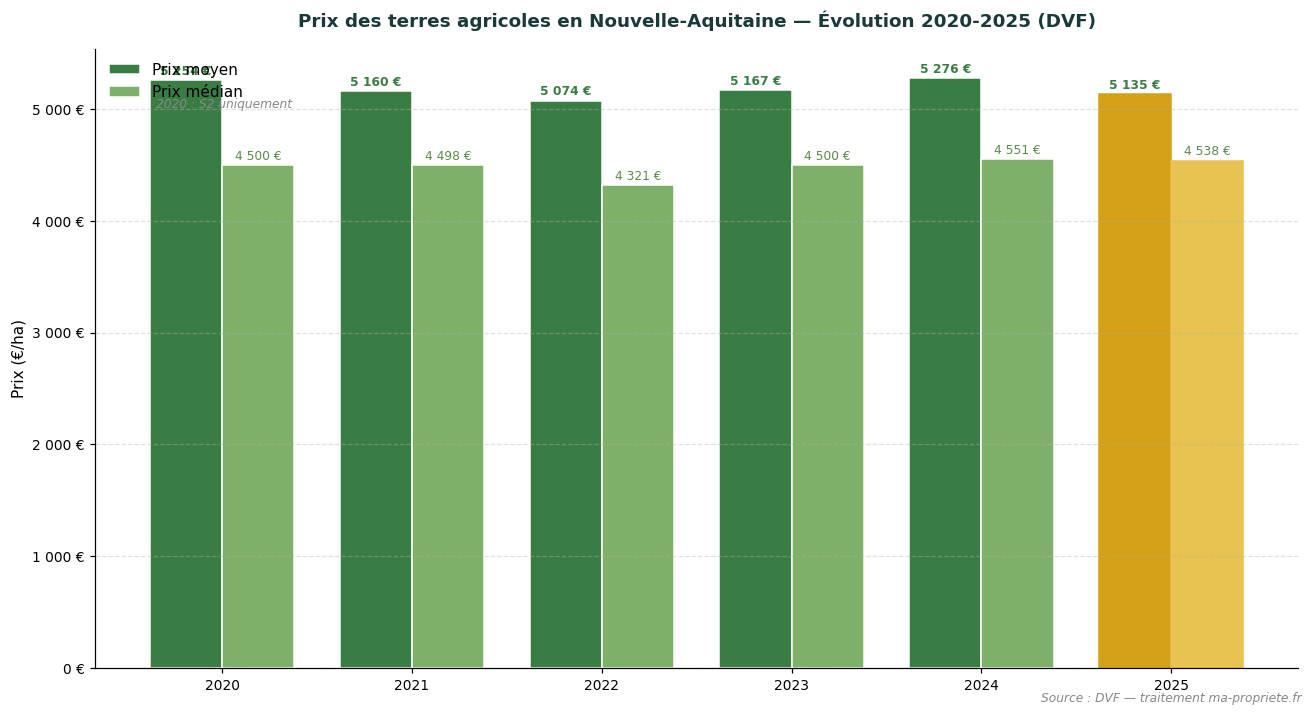
Trend in average and median agricultural land prices in Nouvelle-Aquitaine (2020–2025). Source: DVF, processed by ma-propriete.fr. The year 2025 is highlighted in gold.
The SAFER networks publish an annual summary of agricultural land prices, distinguishing between vacant land sales (plots not occupied by a tenant farmer) and tenanted land sales (plots already under a farm lease). In Nouvelle-Aquitaine, the latest available year is 2024: the average price of vacant land reaches €5,470/ha, compared with €3,770/ha for tenanted land. In 2024, the gap between vacant and tenanted land reaches 31% in Nouvelle-Aquitaine, close to the national average (~18%).
| Year | Vacant land (SAFER) | Tenanted land (SAFER) |
|---|---|---|
| 2015 | €5,390/ha | €3,230/ha |
| 2018 | €5,170/ha | €3,480/ha |
| 2020 | €5,240/ha | €3,620/ha |
| 2022 | €5,470/ha | €3,720/ha |
| 2023 | €5,440/ha | €3,670/ha |
| 2024 | €5,470/ha | €3,770/ha |
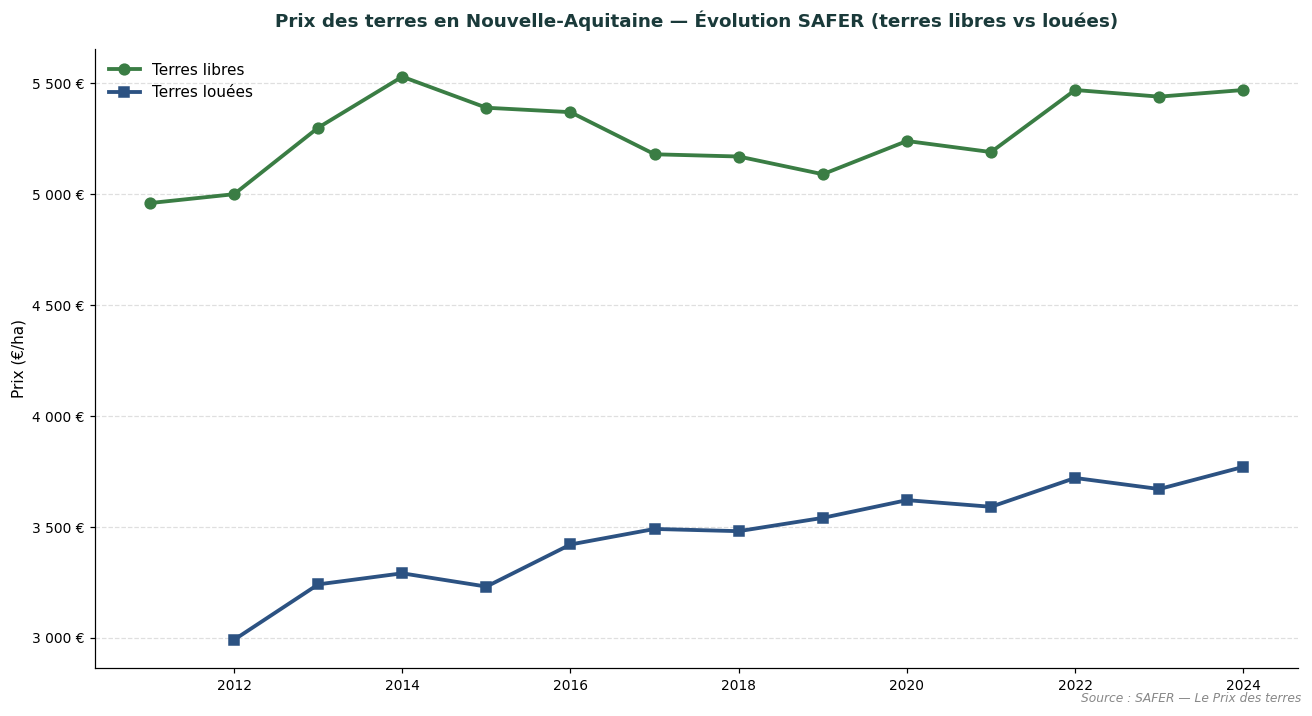
Comparative trend in vacant and tenanted land prices in Nouvelle-Aquitaine. Source: SAFER — Le Prix des terres.
SAFER figures cannot be directly overlaid on the DVF figures presented above: SAFER only covers a portion of the market (transactions subject to pre-emption rights or SAFER intermediation), whereas DVF captures all recorded transfers. The two sources are complementary and make it possible to assess the land market from two distinct angles.
Charente combines arable crops with diversified productions on the fringes of the wine regions. In 2025, the average price of agricultural land in the département stands at €4,708/ha (-4.4% compared with 2024). The median price reaches €4,500/ha, based on 182 recorded transactions (average area 10.62 ha).
| Year | No. of sales | Average price | Median price | Avg. area |
|---|---|---|---|---|
| 2020 | 87 | €5,217/ha | €5,490/ha | 9.71 ha |
| 2021 | 220 | €5,159/ha | €4,601/ha | 10.39 ha |
| 2022 | 208 | €4,681/ha | €4,230/ha | 12.70 ha |
| 2023 | 210 | €4,861/ha | €4,475/ha | 10.77 ha |
| 2024 | 176 | €4,923/ha | €4,566/ha | 10.06 ha |
| 2025 | 182 | €4,708/ha | €4,500/ha | 10.62 ha |
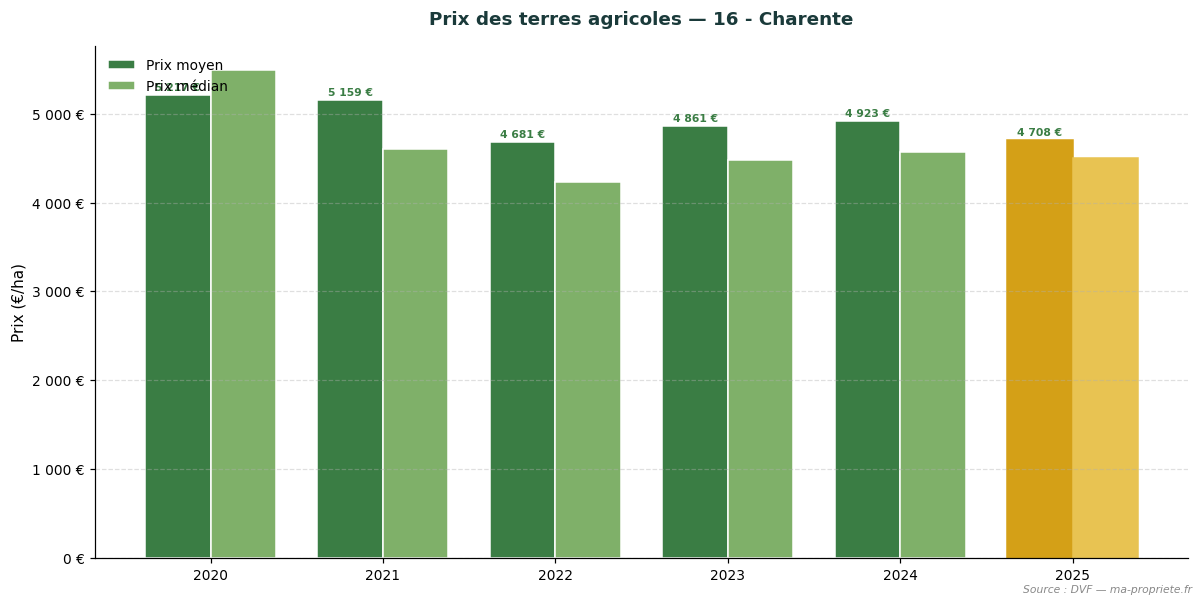
Trend in agricultural land prices — 16 - Charente. Source: DVF, processed by ma-propriete.fr. The year 2025 is highlighted in gold.
Charente-Maritime combines coastal arable crops with label-certified productions. In 2025, the average price of agricultural land in the département stands at €5,256/ha (-1.3% compared with 2024). The median price reaches €5,347/ha, based on 328 recorded transactions (average area 12.35 ha).
| Year | No. of sales | Average price | Median price | Avg. area |
|---|---|---|---|---|
| 2020 | 168 | €4,900/ha | €4,990/ha | 9.74 ha |
| 2021 | 355 | €5,029/ha | €5,000/ha | 9.08 ha |
| 2022 | 330 | €5,369/ha | €5,000/ha | 9.00 ha |
| 2023 | 349 | €5,260/ha | €5,050/ha | 10.36 ha |
| 2024 | 346 | €5,323/ha | €5,184/ha | 10.83 ha |
| 2025 | 328 | €5,256/ha | €5,347/ha | 12.35 ha |
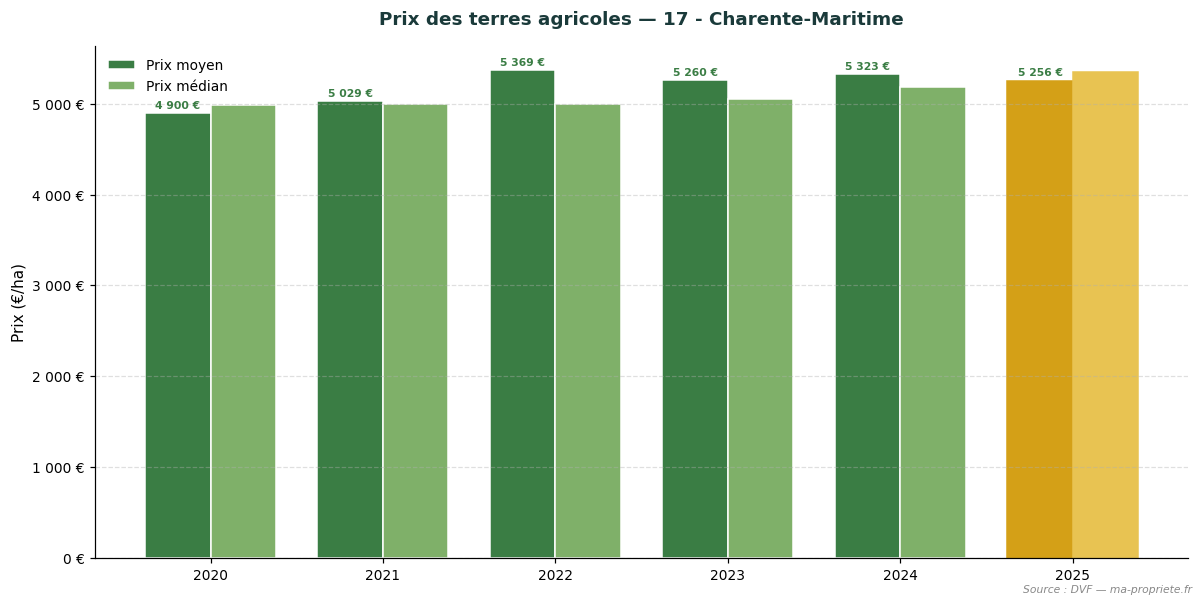
Trend in agricultural land prices — 17 - Charente-Maritime. Source: DVF, processed by ma-propriete.fr. The year 2025 is highlighted in gold.
Corrèze, dominated by cattle and sheep farming, has a very accessible land market. In 2025, the average price of agricultural land in the département stands at €3,797/ha (+3.0% compared with 2024). The median price reaches €3,682/ha, based on 33 recorded transactions (average area 5.92 ha).
| Year | No. of sales | Average price | Median price | Avg. area |
|---|---|---|---|---|
| 2020 | 13 | €6,142/ha | €5,194/ha | 5.05 ha |
| 2021 | 29 | €5,252/ha | €3,750/ha | 5.82 ha |
| 2022 | 32 | €4,370/ha | €3,593/ha | 6.76 ha |
| 2023 | 22 | €5,596/ha | €4,716/ha | 7.48 ha |
| 2024 | 32 | €3,685/ha | €3,579/ha | 6.26 ha |
| 2025 | 33 | €3,797/ha | €3,682/ha | 5.92 ha |
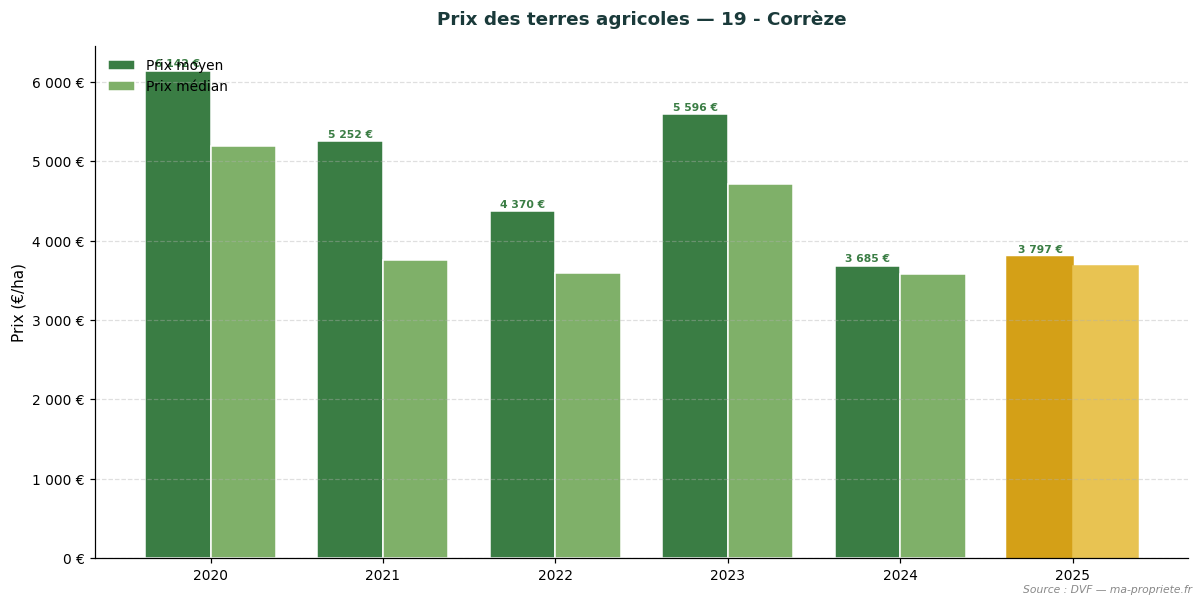
Trend in agricultural land prices — 19 - Corrèze. Source: DVF, processed by ma-propriete.fr. The year 2025 is highlighted in gold.
Creuse, a Limousin suckler cattle farming area, has the most affordable prices in the region. In 2025, the average price of agricultural land in the département stands at €2,780/ha (-4.0% compared with 2024). The median price reaches €2,644/ha, based on 149 recorded transactions (average area 11.86 ha).
| Year | No. of sales | Average price | Median price | Avg. area |
|---|---|---|---|---|
| 2020 | 95 | €2,547/ha | €2,500/ha | 8.99 ha |
| 2021 | 138 | €2,704/ha | €2,513/ha | 10.44 ha |
| 2022 | 163 | €2,601/ha | €2,413/ha | 9.52 ha |
| 2023 | 162 | €2,772/ha | €2,642/ha | 11.58 ha |
| 2024 | 163 | €2,896/ha | €2,675/ha | 10.81 ha |
| 2025 | 149 | €2,780/ha | €2,644/ha | 11.86 ha |
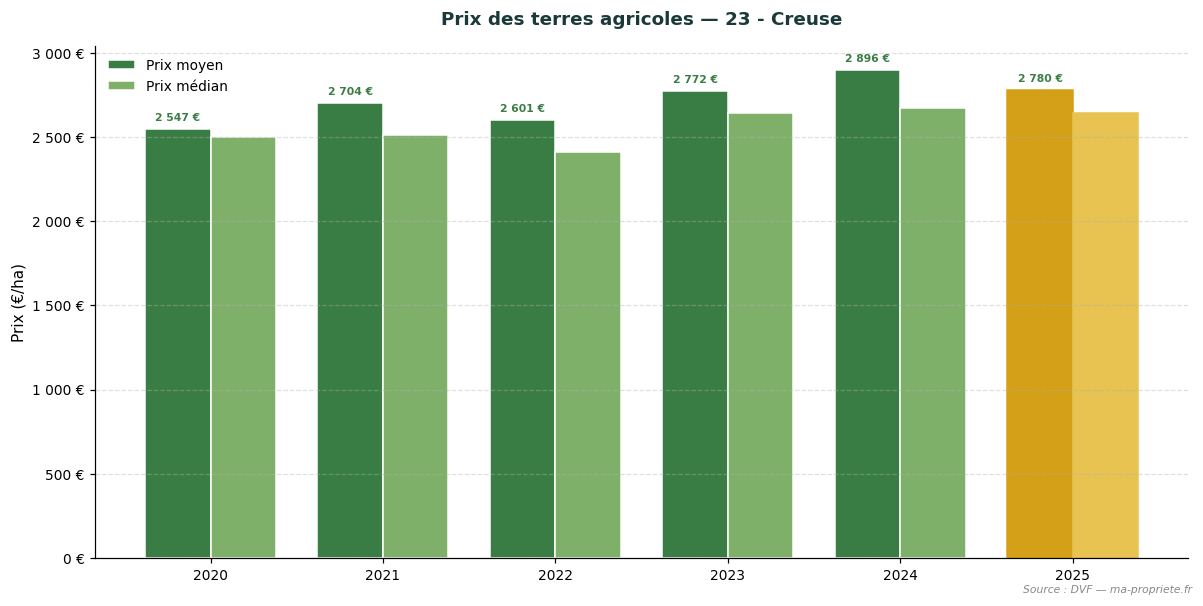
Trend in agricultural land prices — 23 - Creuse. Source: DVF, processed by ma-propriete.fr. The year 2025 is highlighted in gold.
Dordogne combines mixed farming, PGI-labelled productions and livestock farming in a rural setting. In 2025, the average price of agricultural land in the département stands at €4,967/ha (+2.8% compared with 2024). The median price reaches €4,716/ha, based on 126 recorded transactions (average area 9.66 ha).
| Year | No. of sales | Average price | Median price | Avg. area |
|---|---|---|---|---|
| 2020 | 47 | €5,930/ha | €5,252/ha | 9.70 ha |
| 2021 | 97 | €4,921/ha | €4,667/ha | 9.21 ha |
| 2022 | 125 | €5,270/ha | €4,500/ha | 9.41 ha |
| 2023 | 117 | €5,143/ha | €4,568/ha | 9.48 ha |
| 2024 | 95 | €4,832/ha | €4,306/ha | 10.05 ha |
| 2025 | 126 | €4,967/ha | €4,716/ha | 9.66 ha |
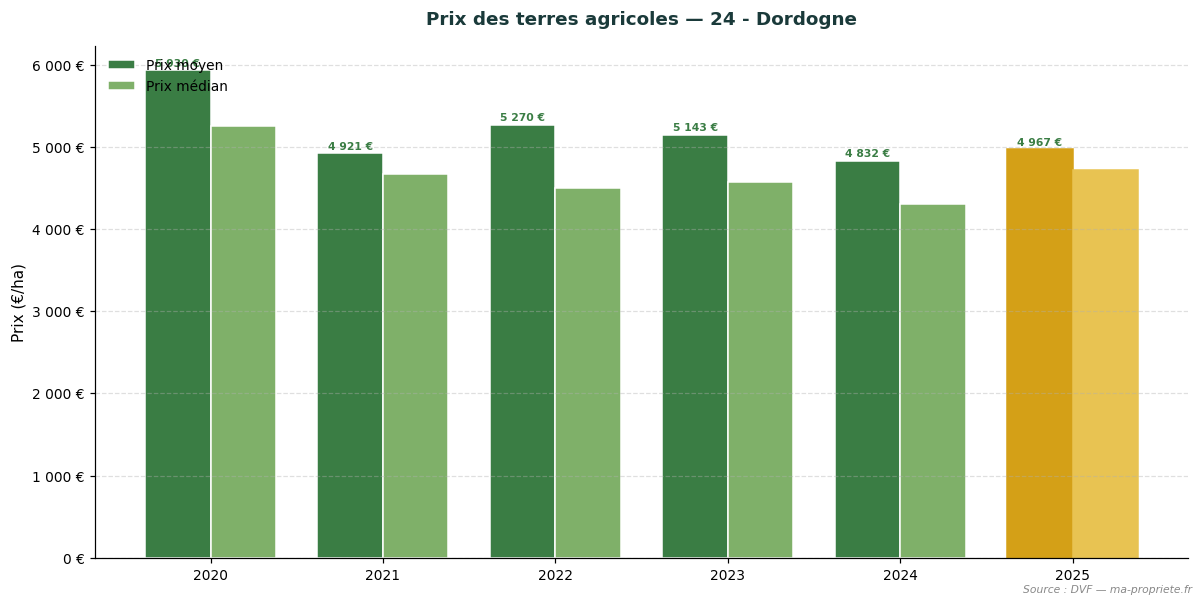
Trend in agricultural land prices — 24 - Dordogne. Source: DVF, processed by ma-propriete.fr. The year 2025 is highlighted in gold.
Gironde (excluding viticulture) presents a more diversified market, with irrigated maize and arable crops. In 2025, the average price of agricultural land in the département stands at €5,536/ha (-3.0% compared with 2024). The median price reaches €5,000/ha, based on 85 recorded transactions (average area 10.09 ha).
| Year | No. of sales | Average price | Median price | Avg. area |
|---|---|---|---|---|
| 2020 | 36 | €5,276/ha | €4,198/ha | 8.12 ha |
| 2021 | 65 | €5,174/ha | €5,000/ha | 9.08 ha |
| 2022 | 60 | €5,182/ha | €4,417/ha | 8.58 ha |
| 2023 | 73 | €5,491/ha | €5,000/ha | 8.86 ha |
| 2024 | 83 | €5,708/ha | €5,000/ha | 11.51 ha |
| 2025 | 85 | €5,536/ha | €5,000/ha | 10.09 ha |
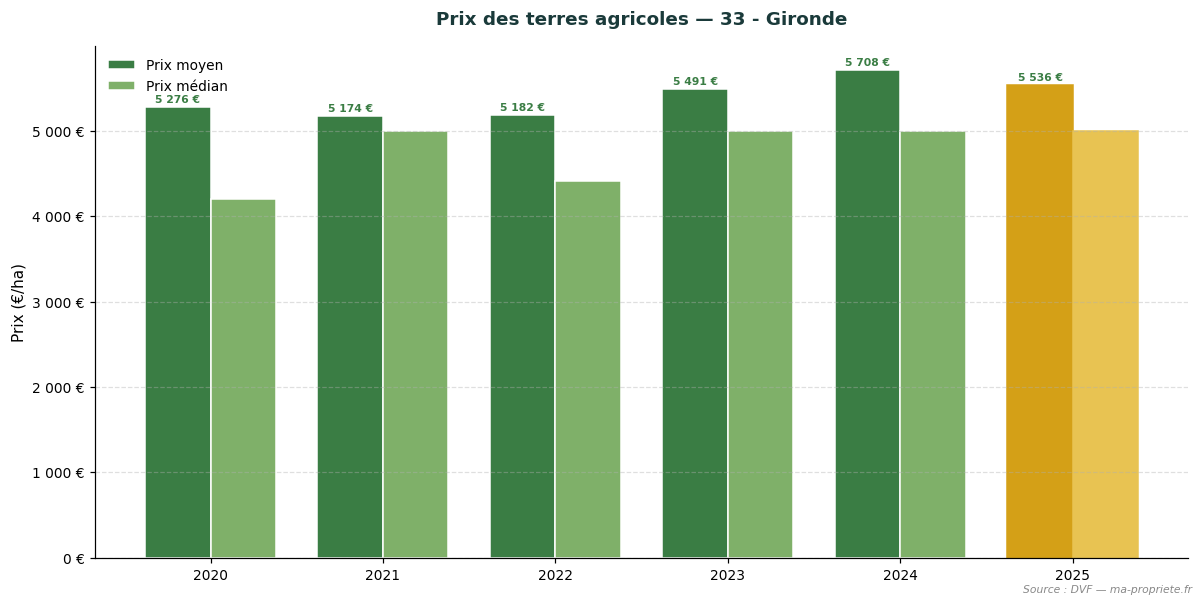
Trend in agricultural land prices — 33 - Gironde. Source: DVF, processed by ma-propriete.fr. The year 2025 is highlighted in gold.
Landes, characterised by irrigated maize and poultry farming (Label Rouge), has an active market. In 2025, the average price of agricultural land in the département stands at €8,618/ha (-6.8% compared with 2024). The median price reaches €8,278/ha, based on 138 recorded transactions (average area 11.26 ha).
| Year | No. of sales | Average price | Median price | Avg. area |
|---|---|---|---|---|
| 2020 | 68 | €8,819/ha | €8,611/ha | 10.12 ha |
| 2021 | 139 | €8,260/ha | €8,000/ha | 10.62 ha |
| 2022 | 127 | €8,401/ha | €8,466/ha | 9.67 ha |
| 2023 | 141 | €7,885/ha | €7,527/ha | 9.19 ha |
| 2024 | 144 | €9,242/ha | €8,364/ha | 9.75 ha |
| 2025 | 138 | €8,618/ha | €8,278/ha | 11.26 ha |
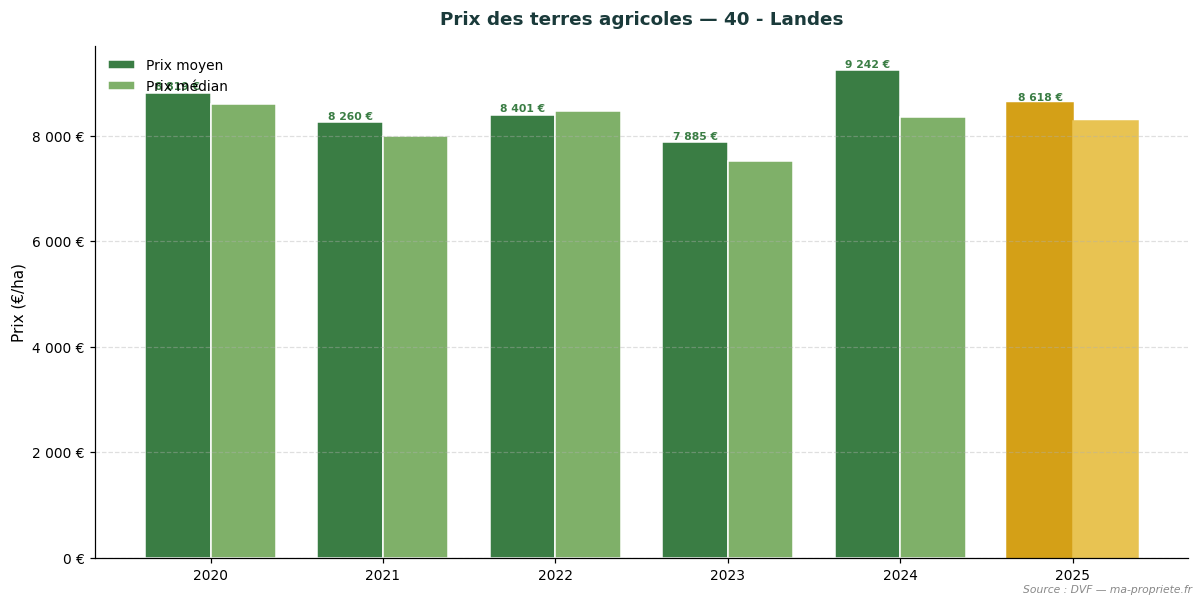
Trend in agricultural land prices — 40 - Landes. Source: DVF, processed by ma-propriete.fr. The year 2025 is highlighted in gold.
Lot-et-Garonne combines orcharding, market gardening and arable crops, with strong diversification. In 2025, the average price of agricultural land in the département stands at €8,547/ha (-6.8% compared with 2024). The median price reaches €7,501/ha, based on 150 recorded transactions (average area 12.90 ha).
| Year | No. of sales | Average price | Median price | Avg. area |
|---|---|---|---|---|
| 2020 | 91 | €9,149/ha | €8,043/ha | 10.68 ha |
| 2021 | 193 | €9,018/ha | €8,237/ha | 9.85 ha |
| 2022 | 187 | €8,434/ha | €7,501/ha | 9.30 ha |
| 2023 | 199 | €8,561/ha | €8,000/ha | 10.19 ha |
| 2024 | 159 | €9,166/ha | €7,992/ha | 9.66 ha |
| 2025 | 150 | €8,547/ha | €7,501/ha | 12.90 ha |
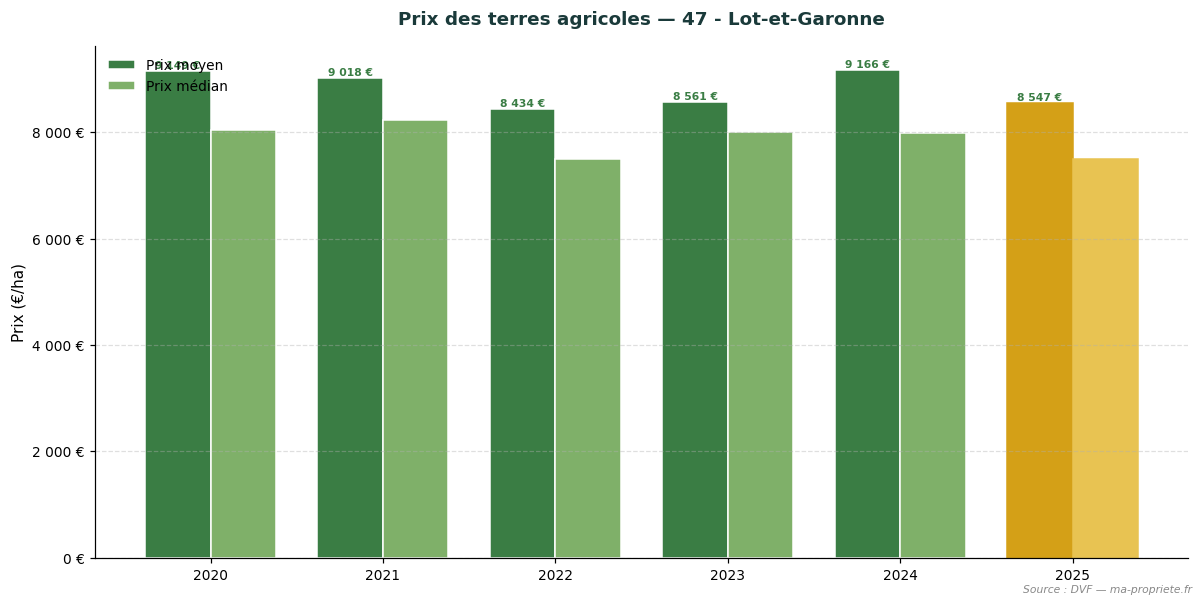
Trend in agricultural land prices — 47 - Lot-et-Garonne. Source: DVF, processed by ma-propriete.fr. The year 2025 is highlighted in gold.
Pyrénées-Atlantiques combines mountain livestock farming, PDO dairy productions and irrigated maize. In 2025, the average price of agricultural land in the département stands at €8,512/ha (-1.8% compared with 2024). The median price reaches €7,931/ha, based on 90 recorded transactions (average area 6.57 ha).
| Year | No. of sales | Average price | Median price | Avg. area |
|---|---|---|---|---|
| 2020 | 54 | €9,244/ha | €8,601/ha | 6.08 ha |
| 2021 | 100 | €8,904/ha | €8,150/ha | 7.15 ha |
| 2022 | 104 | €8,774/ha | €8,257/ha | 7.41 ha |
| 2023 | 111 | €9,345/ha | €9,000/ha | 6.62 ha |
| 2024 | 109 | €8,664/ha | €8,292/ha | 6.19 ha |
| 2025 | 90 | €8,512/ha | €7,931/ha | 6.57 ha |
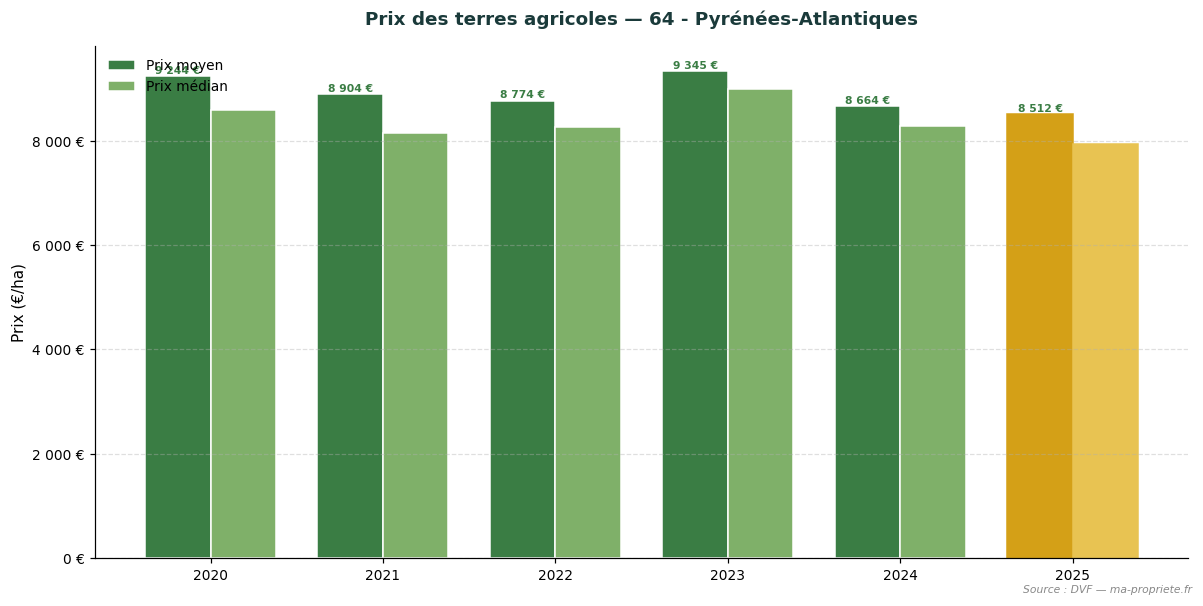
Trend in agricultural land prices — 64 - Pyrénées-Atlantiques. Source: DVF, processed by ma-propriete.fr. The year 2025 is highlighted in gold.
Deux-Sèvres combines suckler livestock farming, arable crops and mixed farming in the Gâtine area. In 2025, the average price of agricultural land in the département stands at €3,376/ha (+0.3% compared with 2024). The median price reaches €3,278/ha, based on 409 recorded transactions (average area 11.97 ha).
| Year | No. of sales | Average price | Median price | Avg. area |
|---|---|---|---|---|
| 2020 | 234 | €3,418/ha | €3,209/ha | 13.28 ha |
| 2021 | 414 | €3,267/ha | €3,067/ha | 11.34 ha |
| 2022 | 464 | €3,252/ha | €3,000/ha | 11.27 ha |
| 2023 | 433 | €3,322/ha | €3,099/ha | 11.70 ha |
| 2024 | 398 | €3,365/ha | €3,256/ha | 11.63 ha |
| 2025 | 409 | €3,376/ha | €3,278/ha | 11.97 ha |
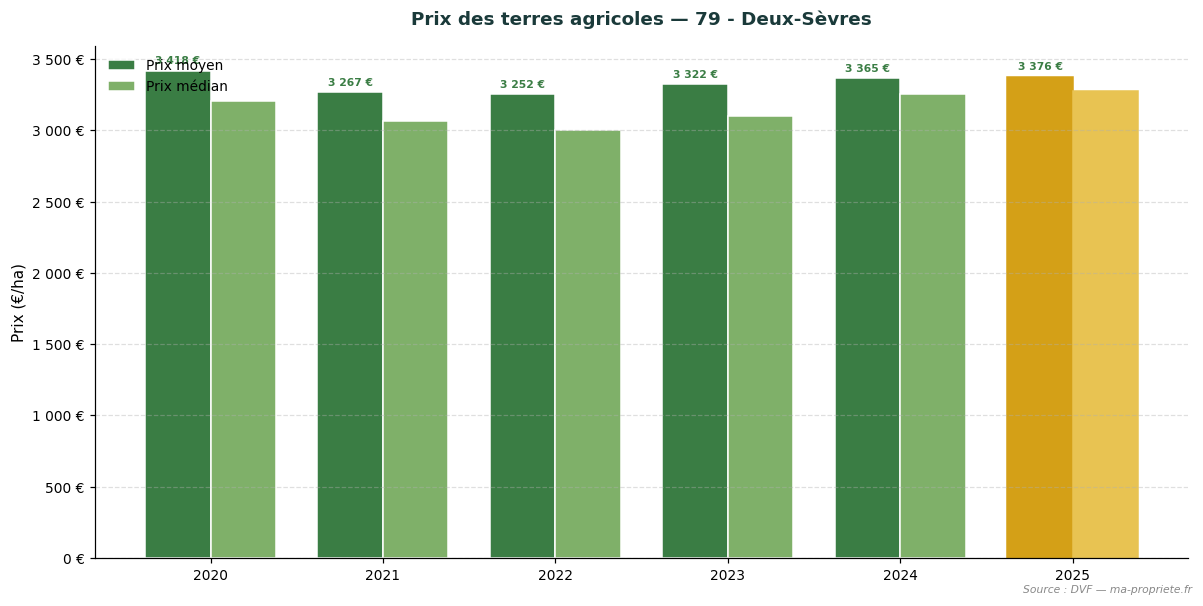
Trend in agricultural land prices — 79 - Deux-Sèvres. Source: DVF, processed by ma-propriete.fr. The year 2025 is highlighted in gold.
Vienne, predominantly arable, has a more active and structured land market. In 2025, the average price of agricultural land in the département stands at €5,288/ha (+0.6% compared with 2024). The median price reaches €5,121/ha, based on 285 recorded transactions (average area 11.92 ha).
| Year | No. of sales | Average price | Median price | Avg. area |
|---|---|---|---|---|
| 2020 | 127 | €5,148/ha | €5,000/ha | 12.50 ha |
| 2021 | 307 | €4,869/ha | €4,818/ha | 12.40 ha |
| 2022 | 341 | €5,148/ha | €4,889/ha | 13.95 ha |
| 2023 | 306 | €4,966/ha | €4,887/ha | 13.91 ha |
| 2024 | 260 | €5,255/ha | €5,000/ha | 12.49 ha |
| 2025 | 285 | €5,288/ha | €5,121/ha | 11.92 ha |
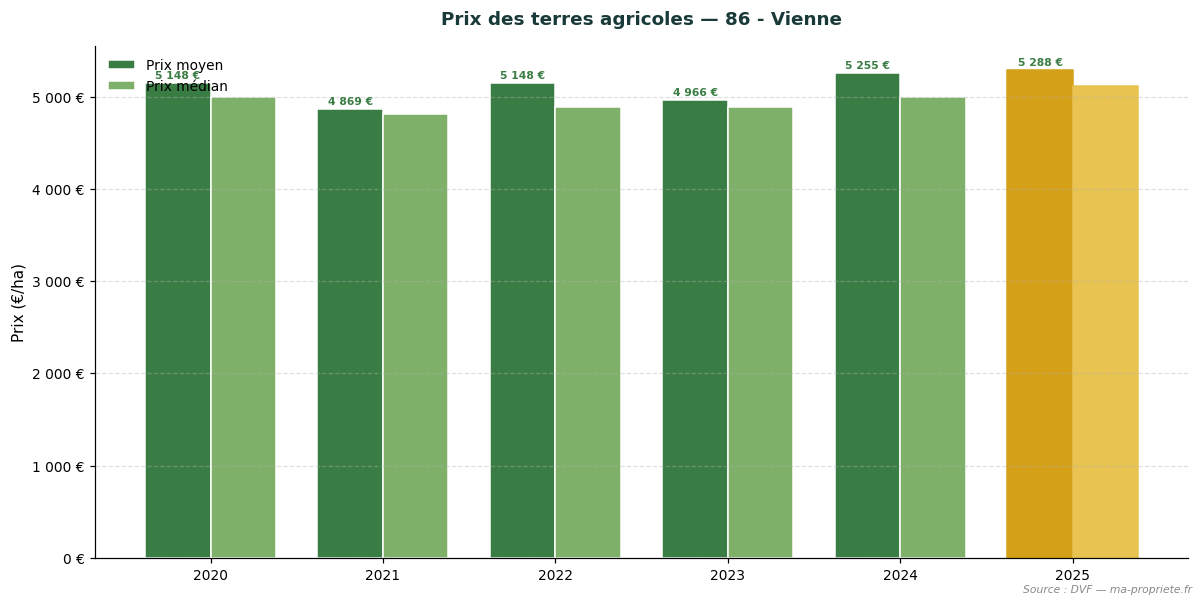
Trend in agricultural land prices — 86 - Vienne. Source: DVF, processed by ma-propriete.fr. The year 2025 is highlighted in gold.
Haute-Vienne, a Limousin livestock farming area, has a moderate land market. In 2025, the average price of agricultural land in the département stands at €3,577/ha (+3.3% compared with 2024). The median price reaches €3,171/ha, based on 128 recorded transactions (average area 9.29 ha).
| Year | No. of sales | Average price | Median price | Avg. area |
|---|---|---|---|---|
| 2020 | 57 | €3,619/ha | €3,155/ha | 9.39 ha |
| 2021 | 135 | €3,153/ha | €2,995/ha | 11.53 ha |
| 2022 | 137 | €3,351/ha | €3,000/ha | 12.48 ha |
| 2023 | 152 | €3,381/ha | €3,013/ha | 12.97 ha |
| 2024 | 166 | €3,462/ha | €3,155/ha | 13.51 ha |
| 2025 | 128 | €3,577/ha | €3,171/ha | 9.29 ha |
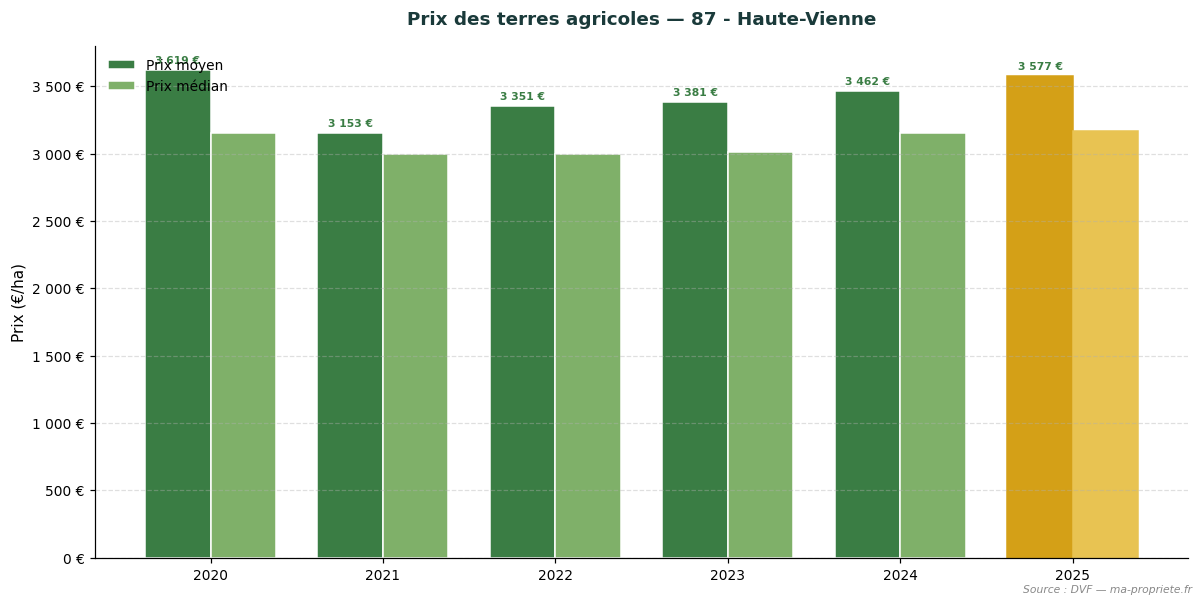
Trend in agricultural land prices — 87 - Haute-Vienne. Source: DVF, processed by ma-propriete.fr. The year 2025 is highlighted in gold.
The statistics presented in this article are based on the DVF (Demandes de Valeurs Foncières) database, made available by the Directorate General of Public Finances. This database records all real property transfers registered in mainland France and the overseas départements. We applied rigorous filtering to retain only transactions corresponding to strictly agricultural plots (arable land, grassland, specialised crops excluding vineyards), systematically excluding built properties, vineyards and AOC wine estates, as well as mixed sales combining plots and buildings.
For each retained transaction, we calculate the price per hectare by dividing the declared property value by the area of the transferred asset. Regional and departmental statistics then aggregate these unit values: average price, median price, first decile (P10) and ninth decile (P90), average area, and total number of annual sales.
The use of DVF data requires several methodological precautions.
The statistics published annually by the SAFER networks (Sociétés d'aménagement foncier et d'établissement rural) and the Ministry of Agriculture differ from our DVF approach in several respects. The SAFER networks rely on transactions subject to their pre-emption rights or intermediation, which covers only a portion of the market. They also explicitly distinguish between vacant land sales (not occupied by a tenant farmer) and tenanted land sales (already under a farm lease), with a structural discount of approximately 18% for the latter.
The DVF approach, being more comprehensive, incorporates all recorded transfers without distinction as to tenancy status. This explains why average DVF price levels may differ from SAFER publications, particularly in regions where the weight of tenanted sales is significant. We present both series in parallel to offer the most complete picture possible of the agricultural land market.
The year 2025 confirms the stability of the agricultural land market in Nouvelle-Aquitaine as a whole, with a regional average price of €5,135/ha (-2.7% vs 2024). Behind this average, the region's 12 départements show differentiated dynamics reflecting the diversity of soils and farming systems. The variety of terroirs accounts for the dispersion of prices: Lot-et-Garonne and Dordogne, with their greater diversification, sit alongside the more moderate markets of Limousin (Creuse, Corrèze, Haute-Vienne).
To keep track of developments in the agricultural land market, visit the agricultural land price observatory on ma-propriete.fr, as well as the farming section and the agricultural listings published on our portal.
To explore the French agricultural land market in greater depth, find our dedicated articles for each region.