Updated on May 7, 2026: Find the most recent data on our Land Price Observatory (DVF data 2020-2025), which presents average and median prices and transaction ranges for your region and each department.
Summary of the main DVF statistics for 2025, now fully available. The figures below relate exclusively to farmland excluding vineyards (field crops, grasslands, arable land, specialty crops).
| 2025 key figures — Centre-Val de Loire | |
|---|---|
| Average price | €5,892/ha |
| Median price | €5,480/ha |
| First decile (P10) | €3,003/ha |
| Ninth decile (P90) | €9,349/ha |
| Number of sales | 1,195 |
| Average area | 13.22 ha |
| Change vs 2024 | -1.8% |
The Centre-Val de Loire region, nicknamed "France's breadbasket," is a heavyweight in major cereal crops. Its Beauce and Touraine plateaus rank among the most productive in the country. With around 2.3 million hectares of UAA (Utilised Agricultural Area), Centre-Val de Loire is one of the largest French agricultural regions by area. The main regional agricultural orientations — cereals (soft wheat, barley, maize), oilseed and protein crops (rapeseed, sunflower), mixed crop-livestock farming in the Berry region, fruit growing, open-field market gardening, large industrial crops (sugar beet, potatoes) — structure a land market whose levels and dynamics differ significantly from one department to another.
This article presents farmland prices in Centre-Val de Loire based on DVF data (Demandes de Valeurs Foncières — French land transaction database) processed by ma-propriete.fr, supplemented by publications from the Ministry of Agriculture based on SAFER data. The year 2025, now fully available, is commented on as a priority; 2024 serves as a comparative reference. The region includes iconic vineyards (Sancerre, Touraine, Chinon) which are expressly excluded from the scope of this article, focused on farmland excluding vineyards.
In 2025, the average farmland price in Centre-Val de Loire stood at €5,892/ha, a change of -1.8% compared to 2024. The median price, an indicator less sensitive to extreme transactions, reached €5,480/ha. Over the year, 1,195 transactions were recorded in the region, with an average area per sale of 13.22 ha.
The gap between the first decile (€3,003/ha) and the ninth decile (€9,349/ha) — a P90/P10 ratio of 3.1 — illustrates the price dispersion within the region. This dispersion reflects the heterogeneity of soils, the diversity of production orientations, and the variability of land pressure depending on the area.
Over the 2021-2025 period (the first years fully covered by DVF), the regional average price has increased (+1.6%).
| Year | Number of sales | Average price | Median price | P10 | P90 | Average area |
|---|---|---|---|---|---|---|
| 2020 | 562 | €5,745/ha | €5,372/ha | €3,008/ha | €8,956/ha | 14.57 ha |
| 2021 | 1,266 | €5,797/ha | €5,446/ha | €3,000/ha | €9,284/ha | 13.05 ha |
| 2022 | 1,344 | €5,868/ha | €5,297/ha | €3,000/ha | €9,500/ha | 13.59 ha |
| 2023 | 1,298 | €5,872/ha | €5,500/ha | €3,046/ha | €9,117/ha | 13.31 ha |
| 2024 | 1,198 | €6,001/ha | €5,500/ha | €3,000/ha | €9,341/ha | 11.76 ha |
| 2025 | 1,195 | €5,892/ha | €5,480/ha | €3,003/ha | €9,349/ha | 13.22 ha |
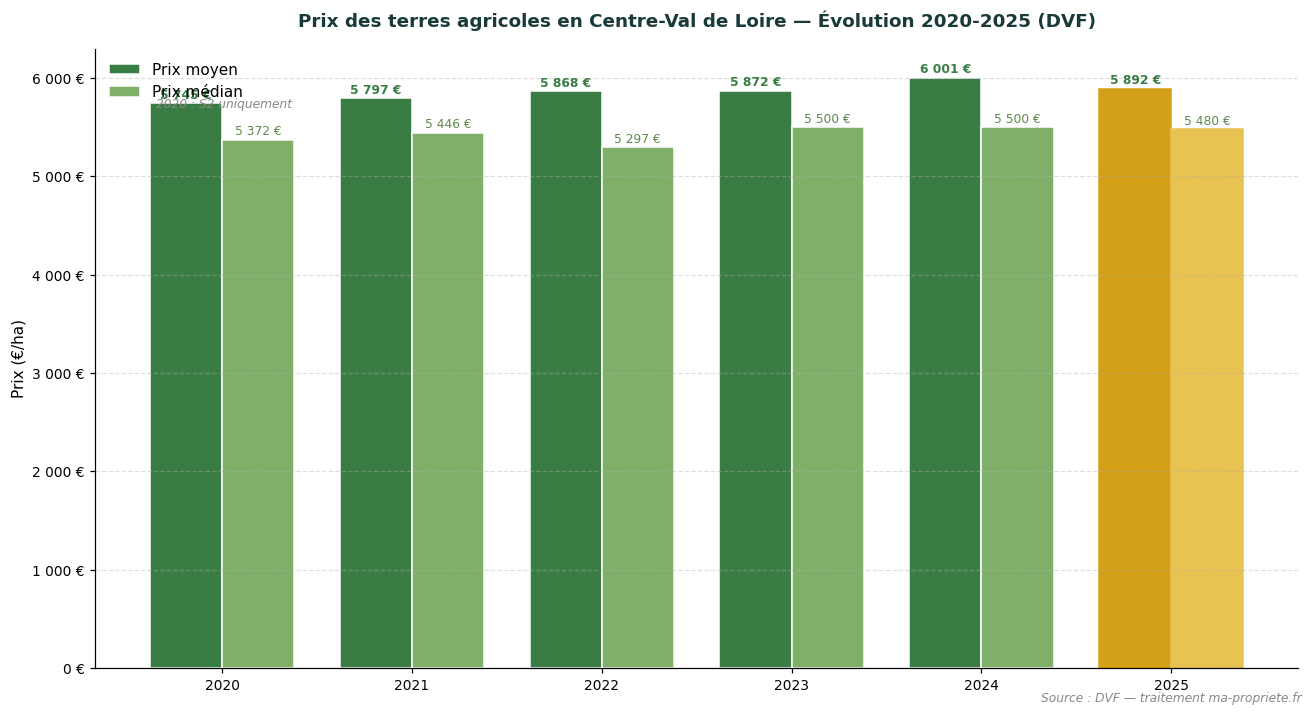
Evolution of average and median farmland prices in Centre-Val de Loire (2020-2025). Source: DVF, processed by ma-propriete.fr. The year 2025 is highlighted in gold.
SAFER publishes an annual summary of farmland prices each year, distinguishing between sales of vacant land (plots not occupied by a tenant farmer) and sales of leased land (plots already under a rural lease). In Centre-Val de Loire, the most recent year available is 2024: the average price of vacant land reached €6,670/ha, compared with €5,580/ha for leased land. In 2024, the gap between vacant and leased land reached 16% in Centre-Val de Loire, in line with the national average (~18%).
| Year | Vacant land (SAFER) | Leased land (SAFER) |
|---|---|---|
| 2015 | €5,780/ha | €4,570/ha |
| 2018 | €6,110/ha | €5,010/ha |
| 2020 | €6,150/ha | €5,150/ha |
| 2022 | €6,020/ha | €5,430/ha |
| 2023 | €6,370/ha | €5,400/ha |
| 2024 | €6,670/ha | €5,580/ha |
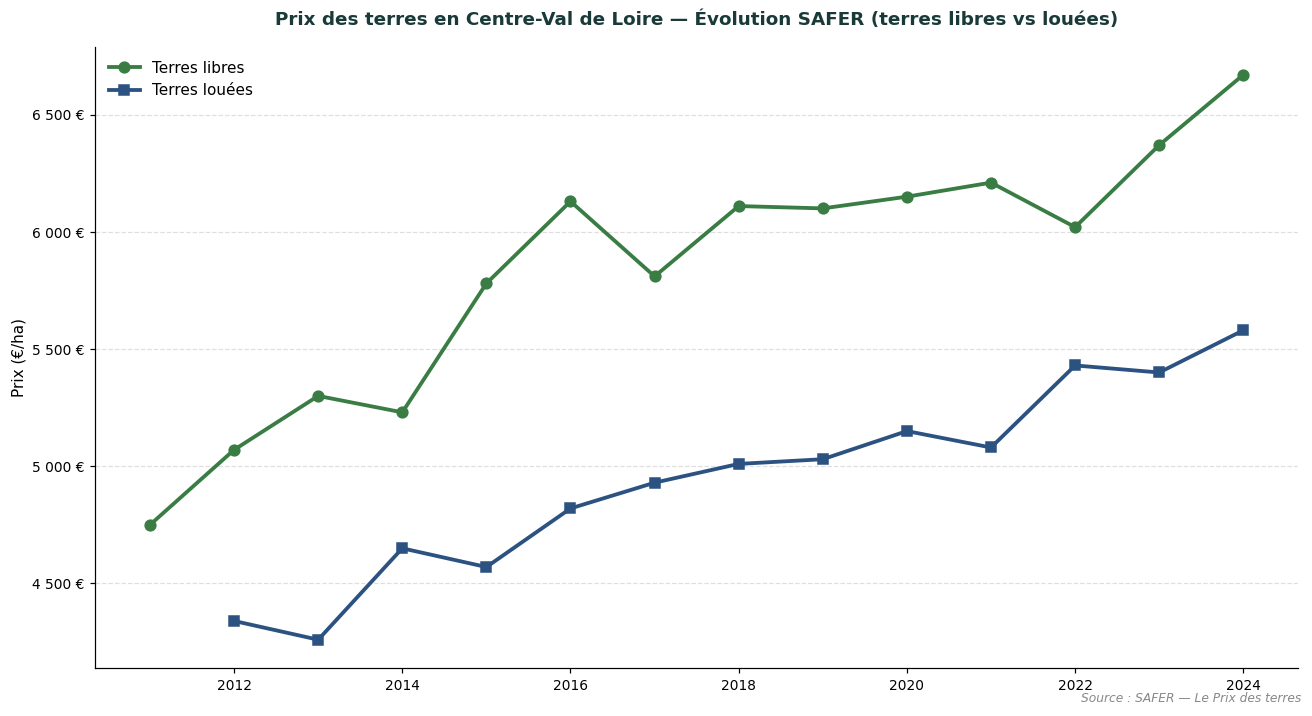
Comparative evolution of vacant and leased land prices in Centre-Val de Loire. Source: SAFER — Le Prix des terres.
SAFER levels are not directly comparable to the DVF levels presented above: SAFER covers only part of the market (transactions subject to pre-emption rights or intermediation), whereas DVF reflects all recorded transfers. The two sources are complementary and allow the land market to be analysed objectively from two distinct angles.
Cher combines mixed crop-livestock farming in the Sologne and major cereal crops in the Champberry. In 2025, the average farmland price in the department stood at €5,310/ha (+0.4% compared to 2024). The median price reached €4,750/ha, based on 199 recorded transactions (average area 19.21 ha).
| Year | No. sales | Average price | Median price | Avg. area |
|---|---|---|---|---|
| 2020 | 91 | €5,240/ha | €4,500/ha | 15.46 ha |
| 2021 | 187 | €5,153/ha | €4,544/ha | 14.80 ha |
| 2022 | 239 | €5,003/ha | €4,320/ha | 16.31 ha |
| 2023 | 202 | €5,603/ha | €5,408/ha | 17.05 ha |
| 2024 | 175 | €5,288/ha | €4,727/ha | 13.74 ha |
| 2025 | 199 | €5,310/ha | €4,750/ha | 19.21 ha |
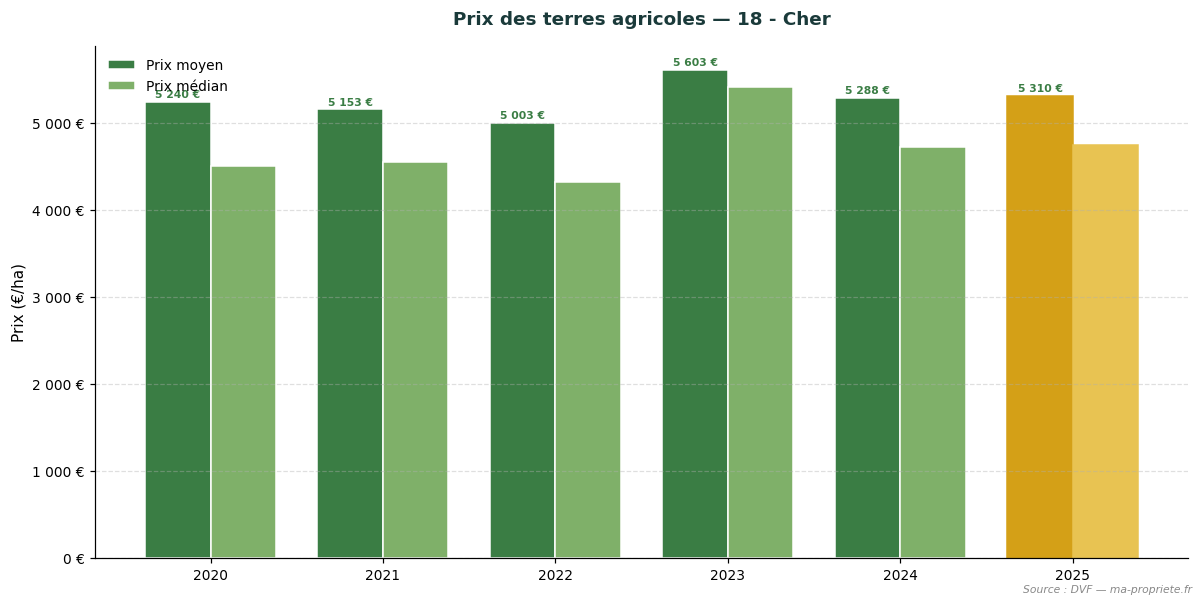
Evolution of farmland prices — 18 - Cher. Source: DVF, processed by ma-propriete.fr. The year 2025 is highlighted in gold.
Eure-et-Loir, on the loams of the Beauce, is one of the departments with the best agronomic potential in France. In 2025, the average farmland price in the department stood at €8,647/ha (-3.3% compared to 2024). The median price reached €8,300/ha, based on 213 recorded transactions (average area 11.10 ha).
| Year | No. sales | Average price | Median price | Avg. area |
|---|---|---|---|---|
| 2020 | 115 | €8,298/ha | €7,779/ha | 13.38 ha |
| 2021 | 283 | €8,048/ha | €7,619/ha | 12.68 ha |
| 2022 | 298 | €8,648/ha | €8,000/ha | 14.48 ha |
| 2023 | 242 | €8,334/ha | €7,881/ha | 11.89 ha |
| 2024 | 244 | €8,938/ha | €8,034/ha | 11.78 ha |
| 2025 | 213 | €8,647/ha | €8,300/ha | 11.10 ha |
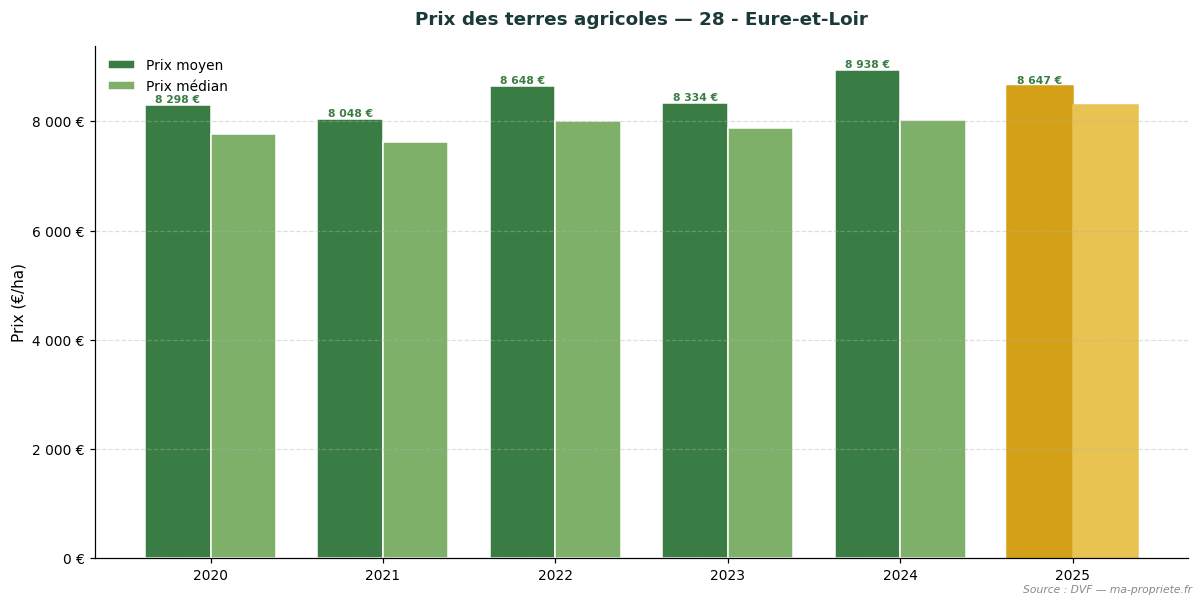
Evolution of farmland prices — 28 - Eure-et-Loir. Source: DVF, processed by ma-propriete.fr. The year 2025 is highlighted in gold.
Indre combines permanent grasslands of the Boischaut and cereal plains of the Champagne berrichonne. In 2025, the average farmland price in the department stood at €5,116/ha (+13.0% compared to 2024). The median price reached €4,500/ha, based on 249 recorded transactions (average area 13.32 ha).
| Year | No. sales | Average price | Median price | Avg. area |
|---|---|---|---|---|
| 2020 | 108 | €5,215/ha | €4,266/ha | 19.03 ha |
| 2021 | 227 | €5,148/ha | €4,221/ha | 14.11 ha |
| 2022 | 237 | €4,887/ha | €4,398/ha | 12.76 ha |
| 2023 | 241 | €5,183/ha | €4,250/ha | 15.11 ha |
| 2024 | 240 | €4,529/ha | €4,000/ha | 10.95 ha |
| 2025 | 249 | €5,116/ha | €4,500/ha | 13.32 ha |
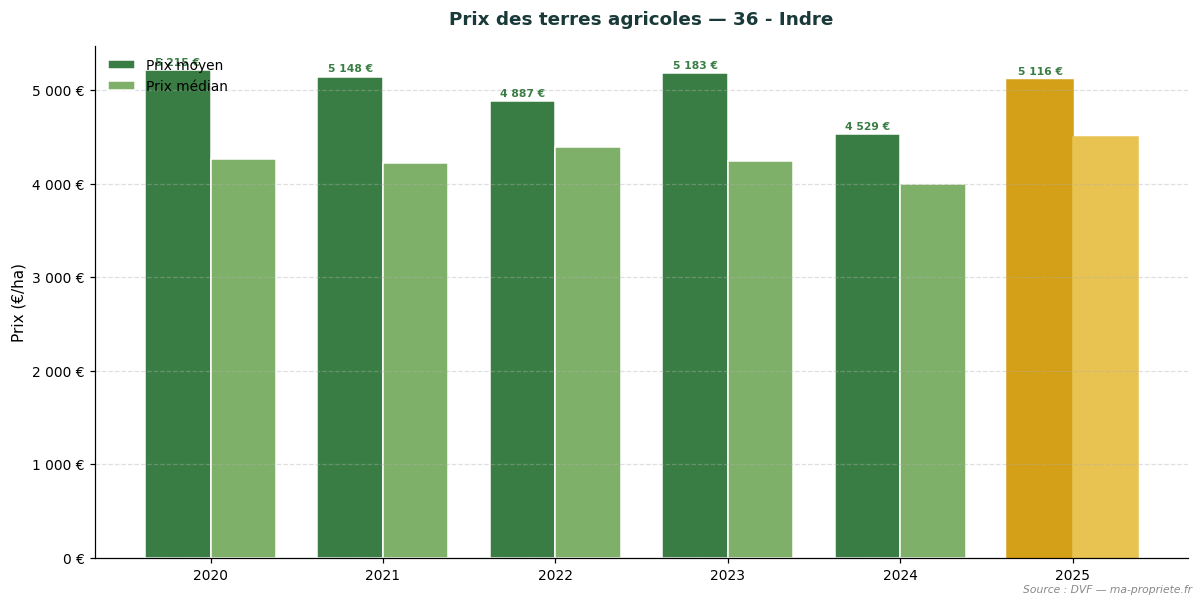
Evolution of farmland prices — 36 - Indre. Source: DVF, processed by ma-propriete.fr. The year 2025 is highlighted in gold.
Indre-et-Loire diversifies crops, mixed crop-livestock farming and fruit growing, with a strong component of grasslands along the Loire. In 2025, the average farmland price in the department stood at €5,460/ha (+0.8% compared to 2024). The median price reached €5,477/ha, based on 201 recorded transactions (average area 13.27 ha).
| Year | No. sales | Average price | Median price | Avg. area |
|---|---|---|---|---|
| 2020 | 73 | €4,890/ha | €4,800/ha | 15.69 ha |
| 2021 | 182 | €5,096/ha | €4,993/ha | 15.22 ha |
| 2022 | 197 | €5,239/ha | €5,000/ha | 12.98 ha |
| 2023 | 217 | €5,271/ha | €5,000/ha | 12.42 ha |
| 2024 | 180 | €5,415/ha | €5,138/ha | 11.53 ha |
| 2025 | 201 | €5,460/ha | €5,477/ha | 13.27 ha |
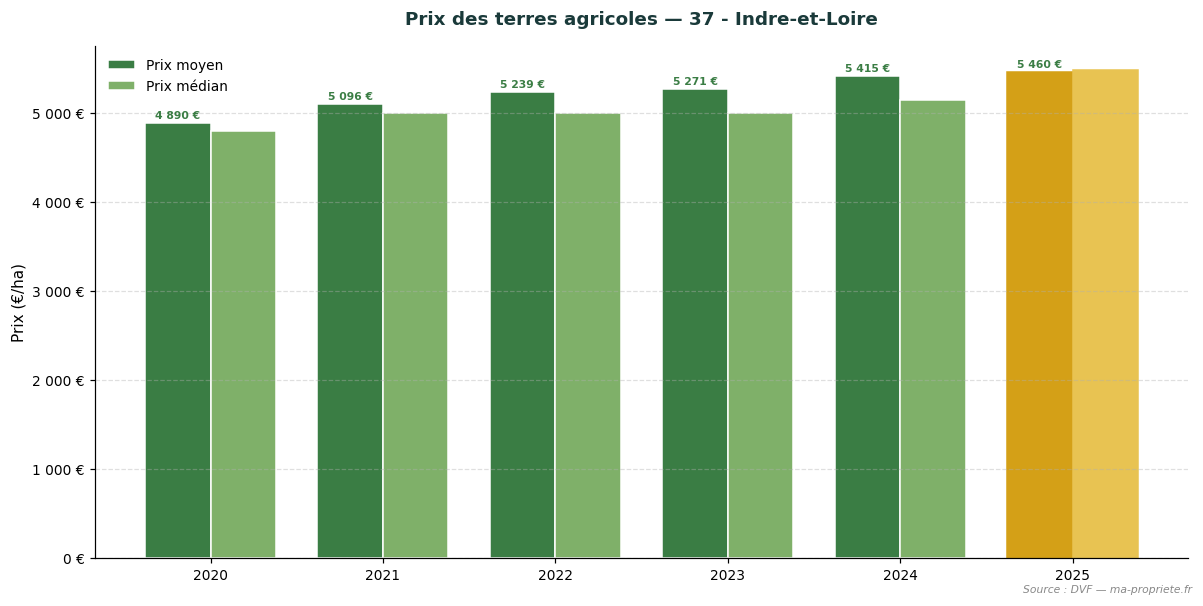
Evolution of farmland prices — 37 - Indre-et-Loire. Source: DVF, processed by ma-propriete.fr. The year 2025 is highlighted in gold.
Loir-et-Cher combines cereal plains in the north and mixed crop-livestock zones in the Sologne. In 2025, the average farmland price in the department stood at €5,031/ha (-3.1% compared to 2024). The median price reached €4,647/ha, based on 173 recorded transactions (average area 12.57 ha).
| Year | No. sales | Average price | Median price | Avg. area |
|---|---|---|---|---|
| 2020 | 72 | €4,434/ha | €3,999/ha | 12.26 ha |
| 2021 | 179 | €4,898/ha | €4,343/ha | 9.86 ha |
| 2022 | 161 | €4,384/ha | €4,100/ha | 12.51 ha |
| 2023 | 181 | €4,625/ha | €4,396/ha | 10.30 ha |
| 2024 | 168 | €5,192/ha | €4,825/ha | 11.47 ha |
| 2025 | 173 | €5,031/ha | €4,647/ha | 12.57 ha |
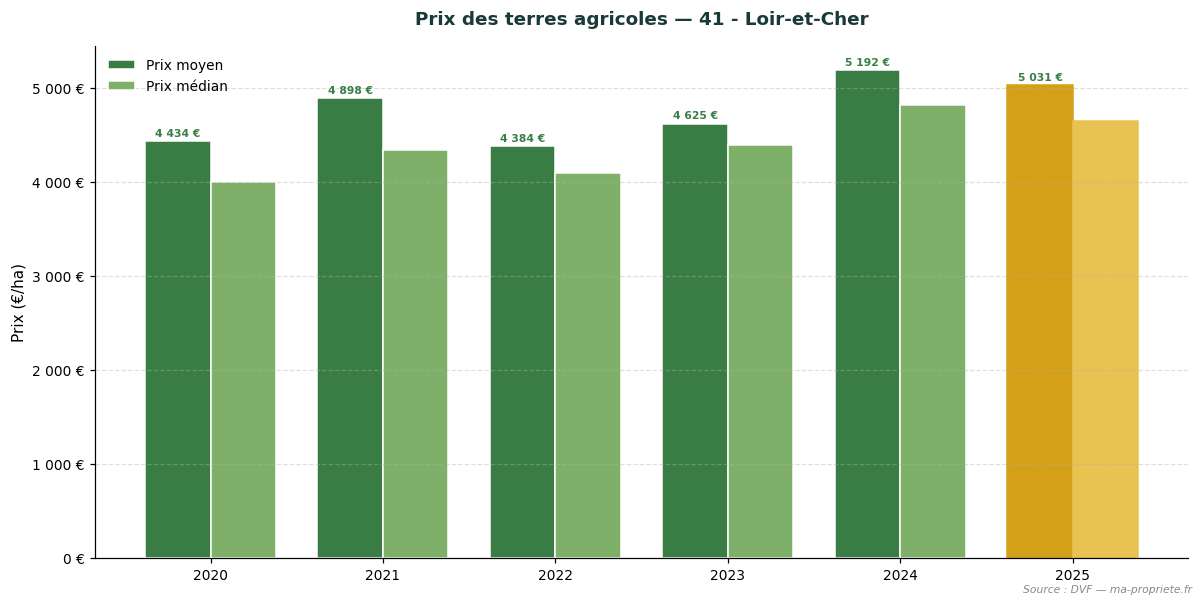
Evolution of farmland prices — 41 - Loir-et-Cher. Source: DVF, processed by ma-propriete.fr. The year 2025 is highlighted in gold.
Loiret, predominantly cereal-growing in the Gâtinais and the Beauce, is close to the standards of the northern Beauce. In 2025, the average farmland price in the department stood at €5,632/ha (-6.4% compared to 2024). The median price reached €5,122/ha, based on 160 recorded transactions (average area 9.12 ha).
| Year | No. sales | Average price | Median price | Avg. area |
|---|---|---|---|---|
| 2020 | 103 | €5,417/ha | €5,337/ha | 11.26 ha |
| 2021 | 208 | €5,410/ha | €5,004/ha | 11.69 ha |
| 2022 | 212 | €5,741/ha | €5,340/ha | 11.55 ha |
| 2023 | 215 | €5,784/ha | €5,500/ha | 12.80 ha |
| 2024 | 191 | €6,014/ha | €5,500/ha | 11.38 ha |
| 2025 | 160 | €5,632/ha | €5,122/ha | 9.12 ha |
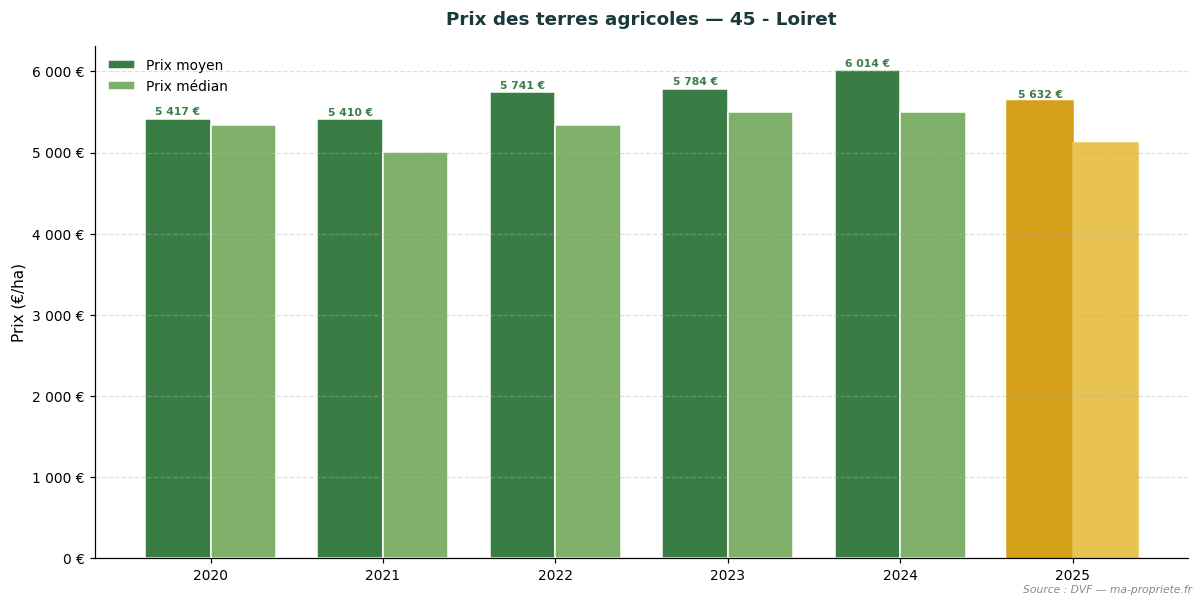
Evolution of farmland prices — 45 - Loiret. Source: DVF, processed by ma-propriete.fr. The year 2025 is highlighted in gold.
The statistics presented in this article are based on the DVF (Demandes de Valeurs Foncières — French land transaction database), made available by the Directorate General of Public Finance. This database lists all real estate land transactions recorded in mainland France and the overseas departments. We have applied rigorous filtering to retain only transactions corresponding to strictly agricultural plots (arable land, grasslands, specialty crops excluding vineyards), systematically excluding built properties, vineyards and AOC vineyards, as well as mixed sales combining plots and buildings.
For each transaction retained, we calculate the price per hectare by relating the declared land value to the area of the property transferred. The regional and departmental statistics then aggregate these unit values: average price, median price, first decile (P10) and ninth decile (P90), average area, and the total number of annual sales.
The use of DVF data calls for several methodological precautions.
The statistics published each year by SAFER (Sociétés d'aménagement foncier et d'établissement rural — French rural land development agencies) and the Ministry of Agriculture differ from our DVF approach on several points. SAFER relies on transactions subject to its pre-emption right or to its intermediation, which covers only part of the market. SAFER also explicitly distinguishes sales of vacant land (not occupied by a tenant farmer) and sales of leased land (already under a rural lease), with a structural discount of around 18% for the latter.
The DVF approach, which is more comprehensive, integrates all recorded transfers without distinguishing rental status. This explains why average DVF levels may differ from SAFER publications, particularly in regions where leased sales account for a significant share. We present both series in parallel to offer the most complete view possible of the agricultural land market.
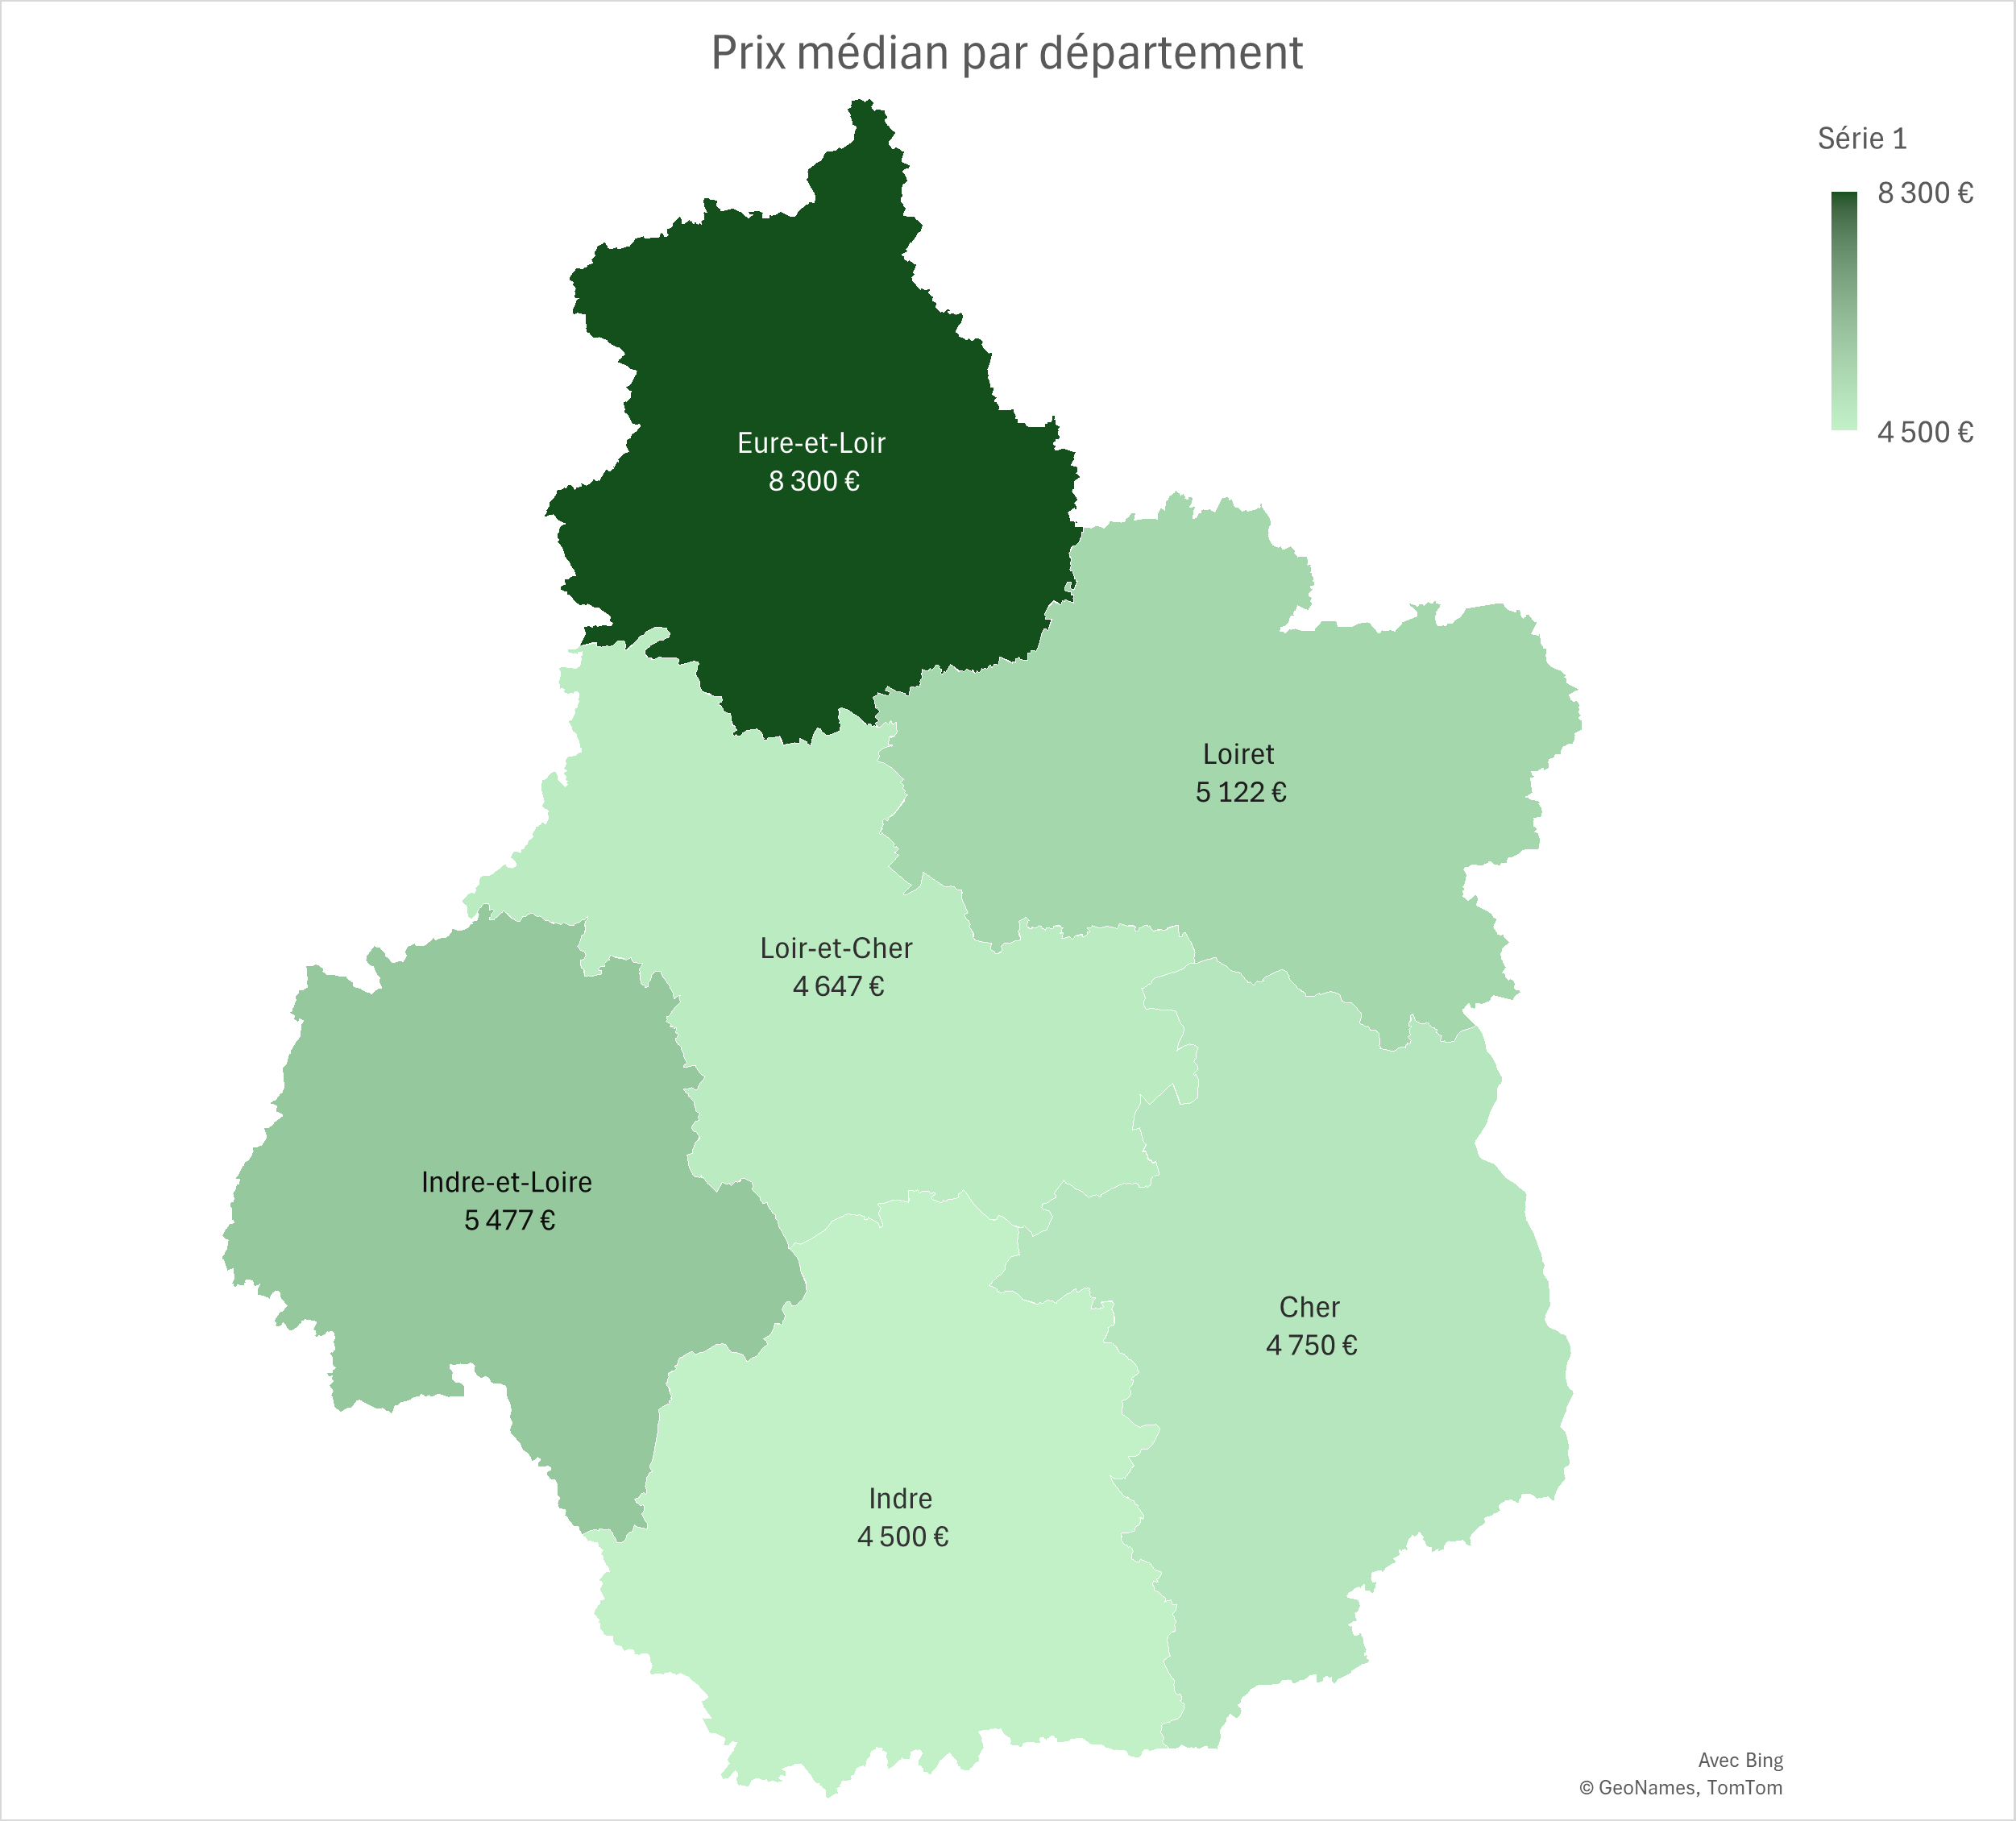
The year 2025 confirms the stability of the agricultural land market in Centre-Val de Loire as a whole, with a regional average price of €5,892/ha (-1.8% vs 2024). Behind this average, the 6 departments of the region show differentiated dynamics that reflect the diversity of soils and production orientations. Eure-et-Loir displays the highest prices in the region, driven by the exceptional agronomic value of the Beauce loams. Conversely, Indre and Cher retain more accessible markets, in line with a less capital-intensive mixed crop-livestock orientation.
To regularly follow the evolution of the agricultural land market, consult the farmland price observatory of ma-propriete.fr, as well as the agricultural section and the agricultural listings published on our portal.
To further explore the analysis of the French agricultural land market, find our articles dedicated to each region.